article thumbnail

Kubernetes in the wild report 2023

Dynatrace

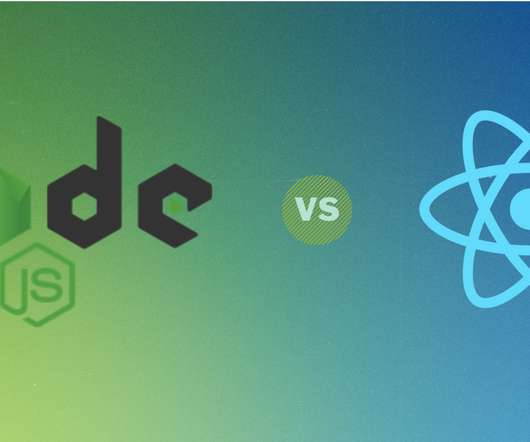
The study analyzes factual Kubernetes production data from thousands of organizations worldwide that are using the Dynatrace Software Intelligence Platform to keep their Kubernetes clusters secure, healthy, and high performing. Open-source software drives a vibrant Kubernetes ecosystem. Java, Go, and Node.js

article thumbnail

Dynatrace supports SnapStart for Lambda as an AWS launch partner

Dynatrace

Lambda then takes a snapshot of the memory and disk state of the initialized execution environment, persists the encrypted snapshot, and caches it for low-latency access. Auto-detection starts monitoring new virtual machines as they are deployed. Modern cloud done right.

Lambda 221
Insiders

Sign Up for our Newsletter

This site is protected by reCAPTCHA and the Google Privacy Policy and Terms of Service apply.

Trending Sources

article thumbnail

Percona Toolkit – A Quick Introduction to Summary

Percona

Installation is easy with the software comes in popular package formats. virtual = 2.2G Caches | 12.4G virtual = 2.2G Caches | 12.4G Percona Toolkit may already be in your distro by default in many Linux distros, such as Fedora, Homebrew, and Debian. And you can get it from us at Percona. Shared | 475.0M

Cache 101
article thumbnail

HammerDB for Managers

HammerDB

HammerDB is a software application for database benchmarking. It enables the user to measure database performance and make comparative judgements about database hardware and software. Databases are highly sophisticated software, and to design and run a fair benchmark workload is a complex undertaking. The HammerDB name.

article thumbnail

Azure Well-Architected Framework: What it is and how to tame it with AI and automation

Dynatrace

Getting precise root cause analysis when dealing with several layers of virtualization in a containerized world. Missing caching layers. Figure 5 shows how the Dynatrace Software Intelligence Platform provides several different types of service-level indicators (SLIs) for defining your SLOs.

Azure 184
article thumbnail

The Return of the Frame Pointers

Brendan Gregg

To explain this example in more detail: The profiler periodically interrupts software execution, and for those disconnected stacks it happens to be the execution of the kernel software ("vfs*", "ext*", etc.). It shouldn't be 10%, unless it's cache effects. These partial stacks get grouped together on the left.

Java 145
article thumbnail

Static Analysis of Java Enterprise Applications: Frameworks and Caches, the Elephants in the Room

The Morning Paper

Static analysis of Java enterprise applications: frameworks and caches, the elephants in the room , Antoniadis et al., Instead, analyses expect their users to provide customization for web applications, which is a significant burden, virtually never overcome in practice. PLDI’20. Introducing JackEE.

Java 80