Remove Cache Remove Latency Remove Metrics Remove Network
article thumbnail

The Three Cs: Concatenate, Compress, Cache

CSS Wizardry

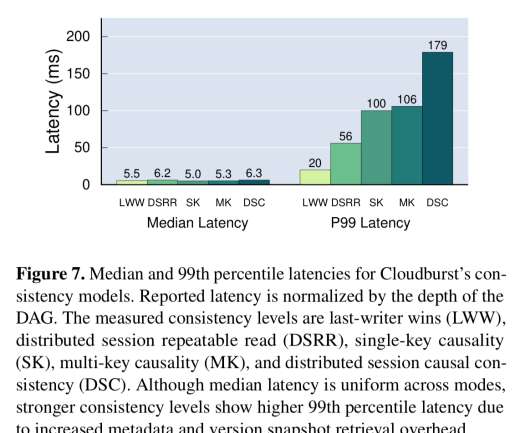
Compressing them over the network: Which compression algorithm, if any, will we use? Caching them at the other end: How long should we cache files on a user’s device? Plotted on the same horizontal axis of 1.6s, the waterfalls speak for themselves: 201ms of cumulative latency; 109ms of cumulative download. It gets worse.

Cache 291
article thumbnail

Crucial Redis Monitoring Metrics You Must Watch

Scalegrid

You will need to know which monitoring metrics for Redis to watch and a tool to monitor these critical server metrics to ensure its health. Redis returns a big list of database metrics when you run the info command on the Redis shell. You can pick a smart selection of relevant metrics from these.

Metrics 130
Insiders

Sign Up for our Newsletter

This site is protected by reCAPTCHA and the Google Privacy Policy and Terms of Service apply.

Trending Sources

article thumbnail

Best practices and key metrics for improving mobile app performance

Dynatrace

Mobile applications (apps) are an increasingly important channel for reaching customers, but the distributed nature of mobile app platforms and delivery networks can cause performance problems that leave users frustrated, or worse, turning to competitors. Some of the most important KPIs are listed below. Performance optimization.

article thumbnail

Dynatrace supports SnapStart for Lambda as an AWS launch partner

Dynatrace

The new Amazon capability enables customers to improve the startup latency of their functions from several seconds to as low as sub-second (up to 10 times faster) at P99 (the 99th latency percentile). This can cause latency outliers and may lead to a poor end-user experience for latency-sensitive applications.

Lambda 227
article thumbnail

Redis® Monitoring Strategies for 2024

Scalegrid

Buckle up as we delve into the world of Redis® monitoring, exploring the most important Redis® metrics, discussing essential tools, and even peering into the future of Redis® performance management. Identifying key Redis® metrics such as latency, CPU usage, and memory metrics is crucial for effective Redis monitoring.

Strategy 130
article thumbnail

Seamlessly Swapping the API backend of the Netflix Android app

The Netflix TechBlog

This allows the app to query a list of “paths” in each HTTP request, and get specially formatted JSON (jsonGraph) that we use to cache the data and hydrate the UI. To prepare ourselves for a big change in the tech stack of our endpoint, we decided to track metrics around the time taken to respond to queries.

Latency 233
article thumbnail

Implementing AWS well-architected pillars with automated workflows

Dynatrace

The Site Reliability Guardian helps automate release validation based on SLOs and important signals that define the expected behavior of your applications in terms of availability, performance errors, throughput, latency, etc. A study by Amazon found that increasing page load time by just 100 milliseconds costs 1% in sales.

AWS 249