article thumbnail

Observability engineering: Getting Prometheus metrics right for Kubernetes with Dynatrace and Kepler

Dynatrace

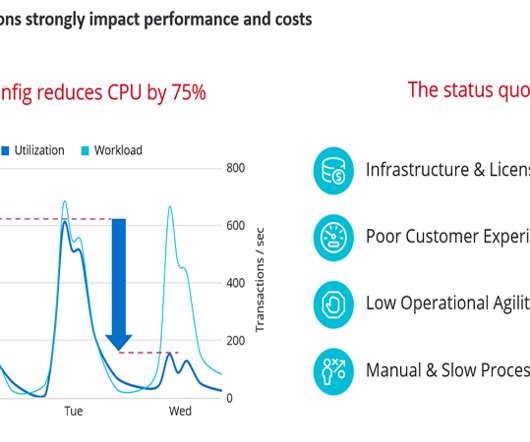
This challenge has given rise to the discipline of observability engineering, which concentrates on the details of telemetry data to fine-tune observability use cases. To get a more granular look into telemetry data, many analysts rely on custom metrics using Prometheus.

Metrics 180
article thumbnail

Support of OpenTelemetry metrics with enhanced AI capabilities

Dynatrace

With the most important components becoming release candidates , Dynatrace now supports the full OpenTelemetry specification on all runtimes and automatically adds intelligence to metrics at enterprise scale. So these metrics are immensely valuable to SRE and DevOps teams. Automation and intelligence for metrics at enterprise scale.

Metrics 230
Insiders

Sign Up for our Newsletter

This site is protected by reCAPTCHA and the Google Privacy Policy and Terms of Service apply.

Trending Sources

article thumbnail

Crucial Redis Monitoring Metrics You Must Watch

Scalegrid

You will need to know which monitoring metrics for Redis to watch and a tool to monitor these critical server metrics to ensure its health. Redis returns a big list of database metrics when you run the info command on the Redis shell. You can pick a smart selection of relevant metrics from these.

Metrics 130
article thumbnail

Simplify observability for all your custom metrics (Part 2: OneAgent metric API)

Dynatrace

Welcome back to the blog series where we provide you with deep dives into the latest observability awesomeness from Dynatrace , demonstrating how we bring scale, zero configuration, automatic AI driven alerting, and root cause analysis to all your custom metrics, including open source observability frameworks like StatsD, Telegraf, and Prometheus.

Metrics 169
article thumbnail

9 key DevOps metrics for success

Dynatrace

The emerging concepts of working with DevOps metrics and DevOps KPIs have really come a long way. DevOps metrics to help you meet your DevOps goals. Like any IT or business project, you’ll need to track critical key metrics. Here are nine key DevOps metrics and DevOps KPIs that will help you be successful.

DevOps 203
article thumbnail

Tech Transforms podcast: Company Culture, Hyperautomation, User Experience in a Zero Trust World, and Security Metrics – June 2022 recap?

Dynatrace

We also explore how to improve user experiences within the Zero Trust framework and how to develop security metrics that eliminate DevSecOps bottlenecks. Tune in for Mark and Willie’s highlights and takeaways from the event. Episode 40 – Security Metrics: Measure Twice, Cut Once with Rick Stewart. Enjoy the summer break!

Metrics 198
article thumbnail

New web performance insights with additional metrics and enhanced Visually complete for synthetic monitors

Dynatrace

Recently introduced improvements to Visually complete and new web performance metrics for Real User Monitoring are now available for Synthetic Monitoring as well. Ensure better user experience with paint-focused performance metrics. These metrics are tightly connected to the perceived load speed of your application.

Metrics 217