Remove Blog Remove Infrastructure Remove Metrics Remove Monitoring
article thumbnail

AI-powered infrastructure monitoring for your SAP HANA database (Preview)

Dynatrace

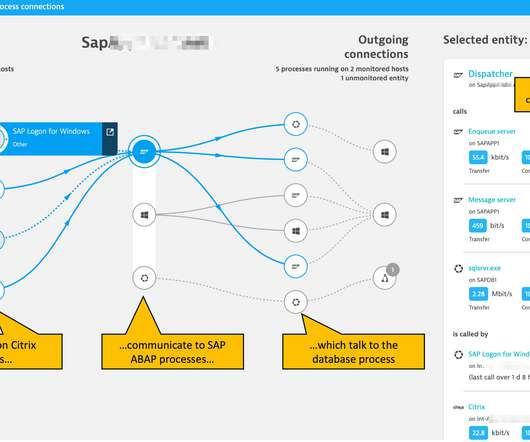
Don’t worry, when it comes to SAP monitoring, Dynatrace has you covered. Dynatrace ActiveGate extensions allow you to integrate Dynatrace monitoring with any remote technology that exposes an interface. Today we’re proud to announce that we’ve extended our SAP monitoring capabilities to support SAP HANA databases.

article thumbnail

Extend infrastructure observability with JMX Extensions and additional full-stack metrics

Dynatrace

Infrastructure exists to support the backing services that are collectively perceived by users to be your web application. Issues that manifest themselves as performance degradation on a user’s device can often be traced back to underlying infrastructure issues. Monitor additional metrics. Dynatrace news.

Insiders

Sign Up for our Newsletter

This site is protected by reCAPTCHA and the Google Privacy Policy and Terms of Service apply.

Trending Sources

article thumbnail

What is infrastructure monitoring and why is it mission-critical in the new normal?

Dynatrace

IT infrastructure is the heart of your digital business and connects every area – physical and virtual servers, storage, databases, networks, cloud services. We’ve seen the IT infrastructure landscape evolve rapidly over the past few years. What is infrastructure monitoring? . Dynatrace news.

article thumbnail

How to collect Prometheus metrics in Dynatrace

Dynatrace

Dynatrace has recently extended its Kubernetes operator by adding a new feature, the Prometheus OpenMetrics Ingest , which enables you to import Prometheus metrics in Dynatrace and build SLO and anomaly detection dashboards with Prometheus data. Here we’ll explore how to collect Prometheus metrics and what you can achieve with them.

Metrics 200
article thumbnail

New web performance insights with additional metrics and enhanced Visually complete for synthetic monitors

Dynatrace

Dynatrace Synthetic Monitoring allows you to proactively monitor the availability of your public as well as your internal web applications and API endpoints from locations around the globe or important internal locations such as branch offices. Synthetic monitors help you find issues before they affect your customers.

Metrics 215
article thumbnail

AI-powered DNS request tracking extends infrastructure observability for high quality network traffic

Dynatrace

The Dynatrace Software Intelligence Platform gives you a complete Infrastructure Monitoring solution for the monitoring of cloud platforms and virtual infrastructure, along with log monitoring and AIOps. If you need to monitor other DNS servers, please let us know. Average query response time.

Traffic 264
article thumbnail

Observability engineering: Getting Prometheus metrics right for Kubernetes with Dynatrace and Kepler

Dynatrace

To get a more granular look into telemetry data, many analysts rely on custom metrics using Prometheus. Named after the Greek god who brought fire down from Mount Olympus, Prometheus metrics have been transforming observability since the project’s inception in 2012.

Metrics 178