Remove Benchmarking Remove Processing Remove Servers Remove Tuning
article thumbnail

PostgreSQL Performance Tuning: Optimizing Database Parameters for Maximum Efficiency

Percona

Out of the box, the default PostgreSQL configuration is not tuned for any particular workload. It is primarily the responsibility of the database administrator or developer to tune PostgreSQL according to their system’s workload. What is PostgreSQL performance tuning? Why is PostgreSQL performance tuning important?

Tuning 52
article thumbnail

MySQL Performance Tuning 101: Key Tips to Improve MySQL Database Performance

Percona

While there is no magic bullet for MySQL performance tuning, there are a few areas that can be focused on upfront that can dramatically improve the performance of your MySQL installation. What are the Benefits of MySQL Performance Tuning? A finely tuned database processes queries more efficiently, leading to swifter results.

Tuning 52
Insiders

Sign Up for our Newsletter

This site is protected by reCAPTCHA and the Google Privacy Policy and Terms of Service apply.

Trending Sources

article thumbnail

Crucial Redis Monitoring Metrics You Must Watch

Scalegrid

You will need to know which monitoring metrics for Redis to watch and a tool to monitor these critical server metrics to ensure its health. Evaluating factors like hit rate, which assesses cache efficiency level, or tracking key evictions from the cache are also essential elements during the Redis monitoring process.

Metrics 130
article thumbnail

Tuning PostgreSQL Database Parameters to Optimize Performance

Percona

Out of the box, the default PostgreSQL configuration is not tuned for any particular workload. It is primarily the responsibility of the database administrator or developer to tune PostgreSQL according to their system’s workload. The checkpoint process flushes the data into the data files. wal_buffers. Conclusion.

Tuning 58
article thumbnail

Is Thread Pool Plugin the Right Choice for Your Workload?

Percona

Two setups running in cluster mode: one in MariaDB+Galera and one with Percona XtraDB Cluster (Percona Server+Galera). We decided to run a few benchmarks to understand how the thread pool affects long-running transactions. For this reason, I’ve set up a server with the following specs: r6a.2xlarge

article thumbnail

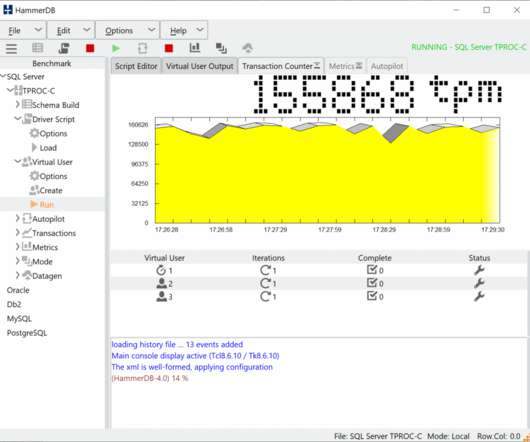
How to Assess MySQL Performance

HammerDB

GHz 4th Generation Intel Xeon Scalable processors (code-named Sapphire Rapids) Up to 20% higher compute performance than z1d instances Up to 50 Gbps of networking speed Up to 40 Gbps of bandwidth to the Amazon Elastic Block Store (EBS) We can also verify these capabilities by running some simple benchmarks on the different subsystems.

article thumbnail

Automated incident management and remediation drive organizational resiliency

Dynatrace

“We were able to … fine-tune our systems in a very performant way,” notes Hood. He and his team thought, “Why can’t these issues be solved autonomously with a platform that has information about these processes?” “Our brain, the source of that knowledge, was the information coming from Dynatrace.”