article thumbnail

Measure What You Impact, Not What You Influence

CSS Wizardry

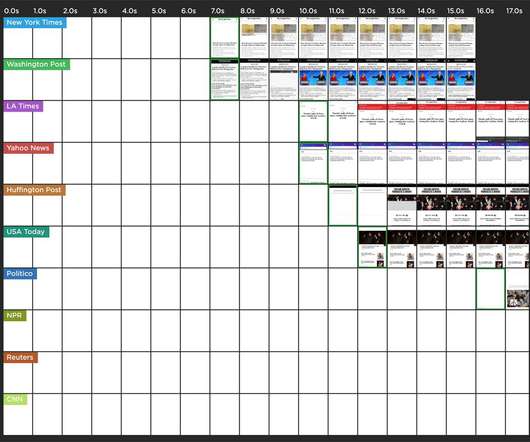
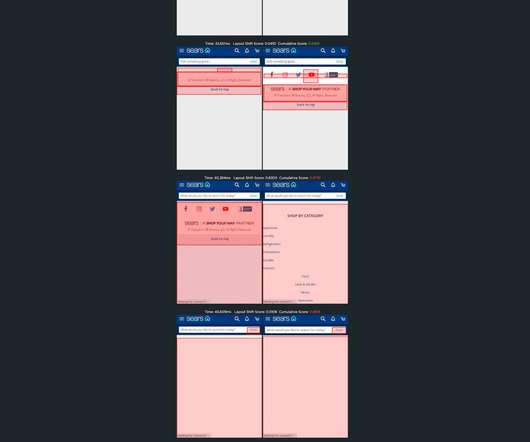
As I see it, there are two main issues when it comes to measuring performance changes (note, not improvements , but changes) in the lab: Site-speed is nondeterministic 1. I can reload the exact same page under the exact same network conditions over and over, and I can guarantee I will not get the exact same, say, DOMContentLoaded each time.

article thumbnail

New Network Fallacies

Tim Kadlec

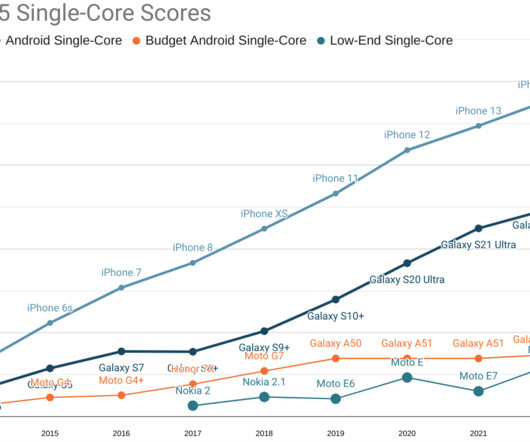
” The fallacy of networks, or new devices for that matter, fixing our performance woes is old and repetitive. To be fair, each new generation of network connectivity does bring some level of change and transformation to how we interact with the internet. In theory, the maximum downlink speed is 100 Mbps.
Network 61
Insiders

Sign Up for our Newsletter

This site is protected by reCAPTCHA and the Google Privacy Policy and Terms of Service apply.

Trending Sources

article thumbnail

In Defence of DOM­Content­Loaded

CSS Wizardry

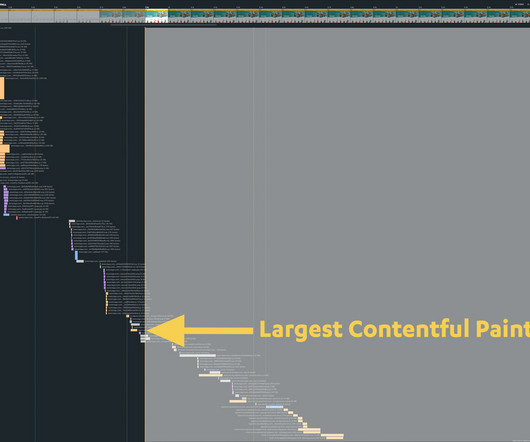
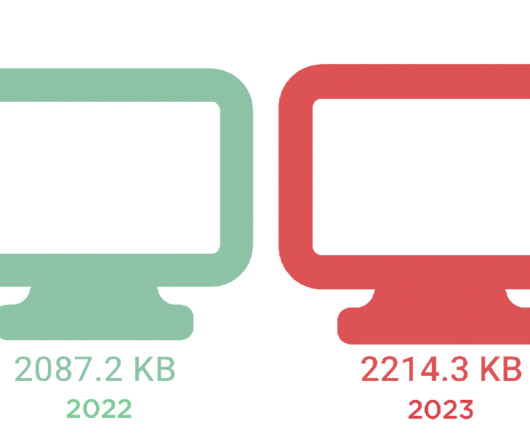
I never thought I’d write an article in defence of DOMContentLoaded , but here it is… For many, many years now, performance engineers have been making a concerted effort to move away from technical metrics such as Load , and toward more user-facing, UX metrics such as Speed Index or Largest Contentful Paint. log ( window. performance.

Metrics 326
article thumbnail

What is software automation? Optimize the software lifecycle with intelligent automation

Dynatrace

DevSecOps and ITOps teams can then perform tasks with accuracy at the speed a business requires. Investigate network systems and application security incidents quickly for near-real-time remediation. Additionally, software analytics enhances the digital customer experience by enabling faster service for high-quality offerings.

Software 187
article thumbnail

Crucial Redis Monitoring Metrics You Must Watch

Scalegrid

Key metrics like throughput, request latency, and memory utilization are essential for assessing Redis health, with tools like the MONITOR command and Redis-benchmark for latency and throughput analysis and MEMORY USAGE/STATS commands for evaluating memory. A reduced throughput could generally indicate that the server gets fewer queries.

Metrics 130
article thumbnail

How to use Server Timing to get backend transparency from your CDN

Speed Curve

Looking at the industry benchmarks for US retailers , four well-known sites have backend times that are approaching – or well beyond – that threshold. Pagespeed Benchmarks - US Retail - LCP When you examine a waterfall, it's pretty obvious that TTFB is the long pole in the tent, pushing out render times for the page.

Servers 58
article thumbnail

Dynatrace Application Security detects and blocks attacks automatically in real-time

Dynatrace

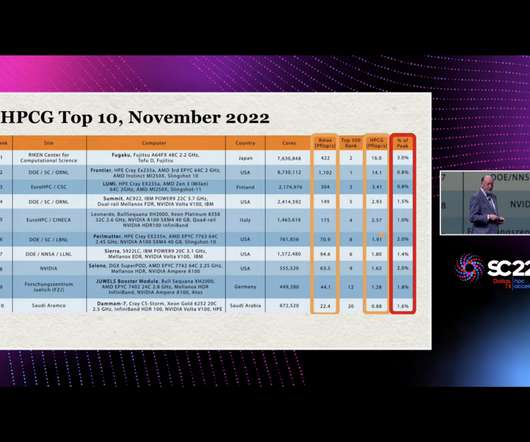
In today’s world, the speed of innovation is key to business success. WAFs protect the network perimeter and monitor, filter, or block HTTP traffic. A perfect OWASP benchmark score for injection attacks – 100% accuracy and zero false positives – impressively proves the precision of our approach. Dynatrace news.

Traffic 233