Remove Benchmarking Remove Google Remove Latency Remove Metrics
article thumbnail

Implementing service-level objectives to improve software quality

Dynatrace

By implementing service-level objectives, teams can avoid collecting and checking a huge amount of metrics for each service. Instead, they can ensure that services comport with the pre-established benchmarks. This process includes benchmarking realistic SLO targets based on statistical and probabilistic analysis from Dynatrace.

Software 263
article thumbnail

How to use Server Timing to get backend transparency from your CDN

Speed Curve

However, that pesky 20% on the back end can have a big impact on downstream metrics like First Contentful Paint (FCP), Largest Contentful Paint (LCP), and any other 'loading' metric you can think of. Google recommends that TTFB be 800ms at the 75th percentile. Also measured by round trip time (RTT).

Servers 57
Insiders

Sign Up for our Newsletter

This site is protected by reCAPTCHA and the Google Privacy Policy and Terms of Service apply.

Trending Sources

article thumbnail

Plan Your Multi Cloud Strategy

Scalegrid

They can also bolster uptime and limit latency issues or potential downtimes. Establishing clear service-level agreements is key as they outline specific responsibilities and performance benchmarks expected from cloud service providers during disaster recovery scenarios.

Strategy 130
article thumbnail

Performance Testing - Tools, Steps, and Best Practices

KeyCDN

Before you begin tuning your website or application, you must first figure out which metrics matter most to your users and establish some achievable benchmarks. Quantitative performance testing looks at metrics like response time while qualitative testing is concerned with scalability, stability, and interoperability.

article thumbnail

Google Lighthouse vs Rigor

Rigor

Reading time 11 min As companies become more aware of the importance of web performance, internal teams begin to research tools they can use to use to track their metrics and improve the user experience of their websites and applications. Where Google Lighthouse Shines Bright. Google Lighthouse has a lot going for it.

Google 51
article thumbnail

A Complete Guide to Performance Budgets

Speed Curve

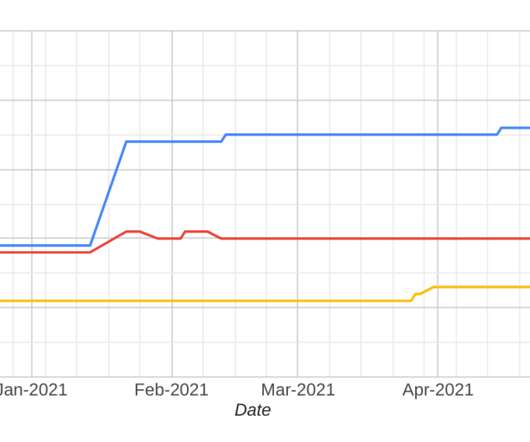
A performance budget is a threshold that you apply to the metrics you care about the most. A good performance budget chart, such as the one above, should show you: The metric you're tracking The threshold you've created for that metric When you exceed that threshold How long you stayed out of bounds When you returned to below the threshold 3.

article thumbnail

Fixing a slow site iteratively

CSS - Tricks

Site performance is potentially the most important metric. Google’s industry benchmarks from 2018 also provide a striking breakdown of how each second of loading affects bounce rates. Source: Google /SOASTA Research, 2018. Speed is also something Google considers when ranking your website placement on mobile.

Cache 92