article thumbnail

MySQL on Azure Performance Benchmark – ScaleGrid vs. Azure Database

Scalegrid

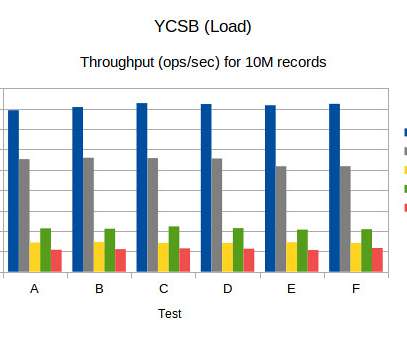
ScaleGrid MySQL on Azure so you can see which provider offers the best throughput and latency performance. We measure latency in ms 95th percentile latency. During Read-Intensive Workloads, ScaleGrid manages to achieve up to 3 times higher throughput and averages 66% better latency compared to Azure Database.

Azure 299
article thumbnail

Benchmark (YCSB) numbers for Redis, MongoDB, Couchbase2, Yugabyte and BangDB

High Scalability

We note that for MongoDB update latency is really very low (low is better) compared to other dbs, however the read latency is on the higher side. The latency table shows that 99th percentile latency for Yugabyte is quite high compared to others (lower is better). Again Yugabyte latency is quite high. Conclusion.

Insiders

Sign Up for our Newsletter

This site is protected by reCAPTCHA and the Google Privacy Policy and Terms of Service apply.

Trending Sources

article thumbnail

Crucial Redis Monitoring Metrics You Must Watch

Scalegrid

Key Takeaways Critical performance indicators such as latency, CPU usage, memory utilization, hit rate, and number of connected clients/slaves/evictions must be monitored to maintain Redis’s high throughput and low latency capabilities. It can achieve impressive performance, handling up to 50 million operations per second.

Metrics 130
article thumbnail

Why you should benchmark your database using stored procedures

HammerDB

HammerDB uses stored procedures to achieve maximum throughput when benchmarking your database. HammerDB has always used stored procedures as a design decision because the original benchmark was implemented as close as possible to the example workload in the TPC-C specification that uses stored procedures. On MySQL, we saw a 1.5X

article thumbnail

How To Scale a Single-Host PostgreSQL Database With Citus

Percona

Leveraging pgbench , which is a benchmarking utility that comes bundled with PostgreSQL, I will put the cluster through its paces by executing a series of DML operations. And now, execute the benchmark: -- execute the following on the coordinator node pgbench -c 20 -j 3 -T 60 -P 3 pgbench The results are not pretty.

Database 102
article thumbnail

The evolution of single-core bandwidth in multicore processors

John McCalpin

I have a lot of historical data using my ReadOnly benchmark (as described in some of the earliest entries in this blog [link] A read-only access pattern removes the need to understand and explain the many complexities associated with the “streaming stores” typically used in the STREAM benchmark (e.g., Stay tuned!

article thumbnail

SLOG: serializable, low-latency, geo-replicated transactions

The Morning Paper

SLOG: serializable, low-latency, geo-replicated transactions Ren et al., That’s where SLOG (Serializable LOw-latency, Geo-replicated transactions) comes in. Data is replicated across regions, but for every data item one of these regions is designated as its home replica. VLDB’19. Is my data at home?

Latency 70