Remove Benchmarking Remove Data Remove Latency Remove Storage
article thumbnail

Comparing PostgreSQL DigitalOcean Performance & Pricing – ScaleGrid vs. DigitalOcean Managed Databases

Scalegrid

Compare Latency. lower latency compared to DigitalOcean for PostgreSQL. On average, ScaleGrid provides over 30% more storage vs. DigitalOcean for PostgreSQL at the same affordable price. Now, let’s take a look at the throughput and latency performance of our comparison. PostgreSQL DigitalOcean Latency Averages (ms).

Database 230
article thumbnail

Crucial Redis Monitoring Metrics You Must Watch

Scalegrid

Key Takeaways Critical performance indicators such as latency, CPU usage, memory utilization, hit rate, and number of connected clients/slaves/evictions must be monitored to maintain Redis’s high throughput and low latency capabilities. These essential data points heavily influence both stability and efficiency within the system.

Metrics 130
Insiders

Sign Up for our Newsletter

This site is protected by reCAPTCHA and the Google Privacy Policy and Terms of Service apply.

Trending Sources

article thumbnail

Maximizing Performance of AWS RDS for MySQL with Dedicated Log Volumes

Percona

A Dedicated Log Volume (DLV) is a specialized storage volume designed to house database transaction logs separately from the volume containing the database tables. DLVs are particularly advantageous for databases with large allocated storage, high I/O per second (IOPS) requirements, or latency-sensitive workloads.

AWS 100
article thumbnail

Redis vs Memcached in 2024

Scalegrid

In this comparison of Redis vs Memcached, we strip away the complexity, focusing on each in-memory data store’s performance, scalability, and unique features. Redis is better suited for complex data models, and Memcached is better suited for high-throughput, string-based caching scenarios.

Cache 130
article thumbnail

How To Scale a Single-Host PostgreSQL Database With Citus

Percona

When it comes to Citus, successfully building out and scaling a PostgreSQL cluster across multiple nodes and even across data centers can feel, at times, to be an art form because there are so many ways of building it out. The following invocation generates almost 4GB of data.

Database 107
article thumbnail

Grafana Dashboards: A PoC Implementing the PostgreSQL Extension pg_stat_monitor

Percona

Configuring Grafana For our purposes, the Grafana datasource used in this PoC is also the Postgres data cluster that is generating the data to be monitored. It collects various statistics data such as query statistics, query plan, SQL comments, and other performance insights. And yes, it even works in PostgreSQL.

article thumbnail

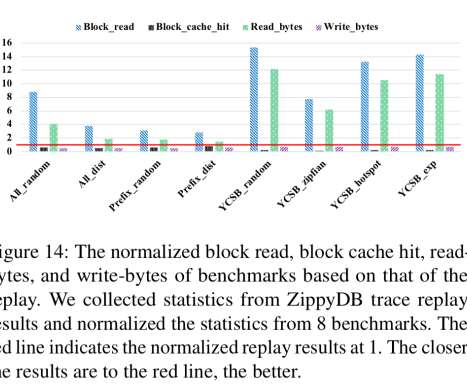
Characterizing, modeling, and benchmarking RocksDB key-value workloads at Facebook

The Morning Paper

Characterizing, modeling, and benchmarking RocksDB key-value workloads at Facebook , Cao et al., Or in the case of key-value stores, what you benchmark. So if you want to design a system that will offer good real-world performance, it’s really useful to have benchmarks that accurately represent real-world workloads.