Remove Azure Remove Database Remove Event Remove Monitoring
article thumbnail

Bandwidth-friendly Query Profiling for Azure SQL Database

SQL Performance

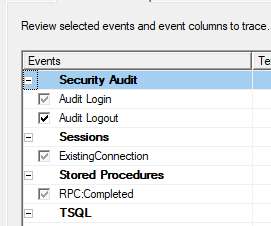
SQL Server has always provided the ability to capture actual queries in an easily-consumable rowset format – first with legacy SQL Server Profiler, later via Extended Events, and now with a combination of those two concepts in Azure SQL Database. Legacy Profiler "Standard" trace events.

Azure 96
article thumbnail

No need to compromise visibility in public clouds with new Azure services supported by Dynatrace (Part 2)

Dynatrace

This is the second part of our blog series announcing the massive expansion of our Azure services support. Part 1 of this blog series looks at some of the key benefits of Azure DB for PostgreSQL, Azure SQL Managed Instance, and Azure HDInsight. Fully automated observability into your Azure multi-cloud environment.

Azure 151
Insiders

Sign Up for our Newsletter

This site is protected by reCAPTCHA and the Google Privacy Policy and Terms of Service apply.

Trending Sources

article thumbnail

Dynatrace accelerates business transformation with new AI observability solution

Dynatrace

The RAG process begins by summarizing and converting user prompts into queries that are sent to a search platform that uses semantic similarities to find relevant data in vector databases, semantic caches, or other online data sources. Observing AI models Running AI models at scale can be resource-intensive.

Cache 199
article thumbnail

The right person at the right time makes all the difference: Best practices for ownership information

Dynatrace

As teams and their structure and metadata are often maintained in a dedicated database, such as Microsoft Entra ID (formerly Azure Active Directory) or ServiceNow. A dedicated workflow allows automatic synchronization of the database information with Dynatrace and keeps the ownership team information up-to-date.

article thumbnail

Dynatrace extends automatic and intelligent observability to cloud and Kubernetes logs for smarter automation at scale

Dynatrace

Leveraging cloud-native technologies like Kubernetes or Red Hat OpenShift in multicloud ecosystems across Amazon Web Services (AWS) , Microsoft Azure, and Google Cloud Platform (GCP) for faster digital transformation introduces a whole host of challenges. Dynatrace news. Logs provide information you can’t find anywhere else.

Cloud 256
article thumbnail

How to Monitor MySQL Deployments with Prometheus & Grafana at ScaleGrid

Scalegrid

Monitoring your MySQL database performance in real-time helps you immediately identify problems and other factors that could be causing issues now or in the future. It’s also a good way to determine which components of the database can be enhanced or optimized to increase your efficiency and performance.

article thumbnail

Sending SentryOne Data to the Azure SQL Database DTU Calculator

SQL Performance

If so, you may have heard about the Azure SQL Database DTU calculator , and you may have also read about how it has been reverse engineered by Andy Mallon. In a lot of cases, many DBAs have some flavor of monitoring tool that is already capturing performance data for them. Database – Log Bytes Flushed/sec.

Azure 40