Remove Availability Remove Demo Remove Open Source Remove Strategy
article thumbnail

Performance Testing with Open Source Tools – Myths and Reality

Alex Podelko

Some time ago Federico Toledo published Performance Testing with Open Source Tools- Busting The Myths. Otherwise we wouldn’t see so many commercial tools built on the top of open source including BlazeMeter (it is ironic that the article is posted on the BlazeMeter site), Flood, and OctoPerf.

article thumbnail

Infrastructure Monitoring tools: 3 steps to evolve ITOps into AIOps

Dynatrace

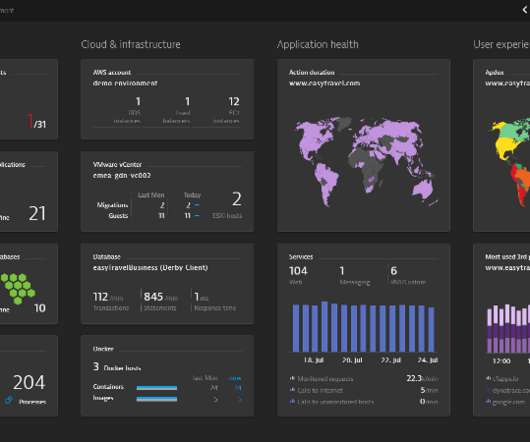
Infrastructure monitoring is the process of collecting critical data about your IT environment, including information about availability, performance and resource efficiency. Effective monitoring and diagnostics starts with availability monitoring. Dynatrace news. This stage is defined by the question “is it up?

Insiders

Sign Up for our Newsletter

This site is protected by reCAPTCHA and the Google Privacy Policy and Terms of Service apply.

Trending Sources

article thumbnail

Using JSONB in PostgreSQL: How to Effectively Store & Index JSON Data in PostgreSQL

Scalegrid

You can also control the TOAST storage strategy: Extended – Allows for out-of-line storage and compression (using pglz). For example, find all books that are available in braille. demo=# select * from books where data ? demo=# explain analyze select * from books where data ? This is the default option.

Storage 321
article thumbnail

Dynatrace Application Security protects your applications in complex cloud environments

Dynatrace

Open source has also become a fundamental building block of the entire cloud-native stack. While leveraging cloud-native platforms, open-source and third-party libraries accelerate time to value significantly, it also creates new challenges for application security.

Cloud 289
article thumbnail

Observability engineering: Getting Prometheus metrics right for Kubernetes with Dynatrace and Kepler

Dynatrace

Another source reported a 43% overall increase in Prometheus adoption for the last six months of 2021. As the two first graduates of the open source project incubator, the Cloud Native Computing Foundation (CNCF), Kubernetes and Prometheus are usually deployed together. What is Prometheus?

Metrics 177
article thumbnail

What is digital experience?

Dynatrace

Organizations are constantly being measured against the best available digital experiences — coming from Google, Amazon, Facebook, and other industry leaders. Some of the factors that affect user experience include: Availability : Is the touchpoint available when the user wants to use it? Net promoter score.

Mobile 216
article thumbnail

What is APM?

Dynatrace

Practitioners use APM to ensure system availability, optimize service performance and response times, and improve user experiences. Application performance monitoring focuses on specific metrics and measurements; application performance management is the wider discipline of developing and managing an application performance strategy.