Remove Availability Remove Database Remove Metrics Remove Servers
article thumbnail

Versatile observability for relational databases

Dynatrace

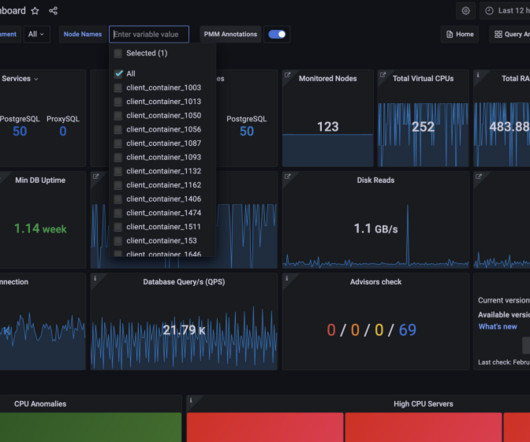
Running Databases efficiently is crucial for business success Monitoring databases is essential in large IT environments to prevent potential issues from becoming major problems that result in data loss or downtime. However, horizontal scaling of these databases can take time and effort.

Database 204
article thumbnail

Crucial Redis Monitoring Metrics You Must Watch

Scalegrid

RedisĀ® is an in-memory database that provides blazingly fast performance. This makes it a compelling alternative to disk-based databases when performance is a concern. You will need to know which monitoring metrics for Redis to watch and a tool to monitor these critical server metrics to ensure its health.

Metrics 130
Insiders

Sign Up for our Newsletter

This site is protected by reCAPTCHA and the Google Privacy Policy and Terms of Service apply.

Trending Sources

article thumbnail

Intelligent observability for Oracle and SQL databases

Dynatrace

While applications are built using a variety of technologies and frameworks, there is one thing they usually have in common: the data they work with must be stored in databases. Now, Dynatrace has gone a step further and expanded its coverage and intelligent observability into the next layer: database infrastructure.

Database 242
article thumbnail

Extend business observability: Extract business events from online databases (Part 2)

Dynatrace

In part 2, weā€™ll show you how to retrieve business data from a database, analyze that data using dashboards and ad hoc queries, and then use a Davis analyzer to predict metric behavior and detect behavioral anomalies. Dynatrace users typically use extensions to pull technical monitoring data, such as device metrics, into Dynatrace.

Database 272
article thumbnail

Unmatched scalability and security of Dynatrace extensions now available for all supported technologies: 7 reasons to migrate your JMX and Python plugins

Dynatrace

already address SNMP, WMI, SQL databases, and Prometheus technologies, serving the monitoring needs of hundreds of Dynatrace customers. address these limitations and brings new monitoring and analytical capabilities that werenā€™t available to Extensions 1.0: Comprehensive metrics support Extensions 2.0 Extensions 2.0

article thumbnail

How to collect Prometheus metrics in Dynatrace

Dynatrace

Dynatrace has recently extended its Kubernetes operator by adding a new feature, the Prometheus OpenMetrics Ingest , which enables you to import Prometheus metrics in Dynatrace and build SLO and anomaly detection dashboards with Prometheus data. Here weā€™ll explore how to collect Prometheus metrics and what you can achieve with them.

Metrics 203
article thumbnail

AI-powered infrastructure monitoring for your SAP HANA database (Preview)

Dynatrace

If youā€™re running SAP, you’re likely already familiar with the HANA relational database management system. However, if you’re an operations engineer who’s been tasked with migrating to HANA from a legacy database system, you’ll need to get up to speed quickly. Avoid false positives with auto-adaptive baselining.