article thumbnail

Flexible, scalable, self-service Kubernetes native observability now in General Availability

Dynatrace

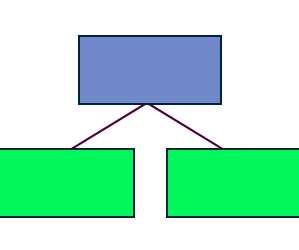
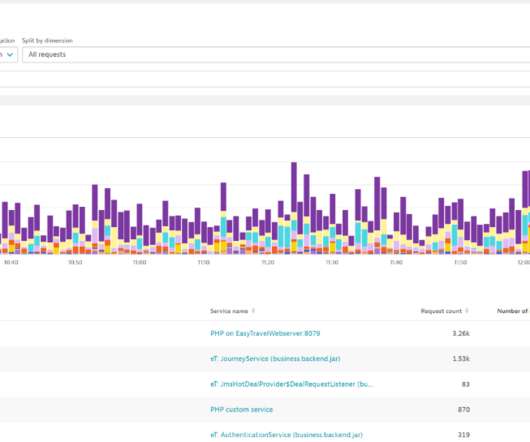
The application consists of several microservices that are available as pod-backed services. This file is automatically configured with working defaults, but it can be easily modified using a code editor such as VS Code. Stay tuned for more awesome Dynatrace Kubernetes announcements throughout the year.

article thumbnail

Software intelligence as code enables tailored observability, AIOps, and application security at scale

Dynatrace

Key components of GitOps are declarative infrastructure as code, orchestration, and observability. Many observability solutions don’t support an “as code” approach. Dynatrace enables software intelligence as code. Observability is required for effective collaboration and automation.

Code 225
Insiders

Sign Up for our Newsletter

This site is protected by reCAPTCHA and the Google Privacy Policy and Terms of Service apply.

Trending Sources

article thumbnail

Percona Server for MongoDB 7 Is Now Available

Percona

Percona provides a drop-in replacement solution for MongoDB Community Edition that is based on the same upstream code delivered by MongoDB, Inc. Availability solutions – Advanced backups, including physical backups and point-in-time recovery that are not available to MongoDB Community Edition.

article thumbnail

An approach to index tuning – Part 2

SQL Performance

In my last post , I started to outline the process I go through when tuning queries – specifically when I discover that I need to add a new index, or modify an existing one. This is where index tuning becomes an art. It's a function of frequency of execution, query importance/relevance, and the time I have available/allocated.

Tuning 137
article thumbnail

Kubernetes Observability: Code Profiling With Flame Graphs

Percona

It shows which code paths are more busy on the CPU in given samples. That said, your application may not be in the list of supported languages, but if it’s compatible with any of the available profilers, you can still produce flame graphs. Flame graphs are a graphical representation of function calls. ✔ Launching profiler.

Code 110
article thumbnail

Monitoring-as-code through Dynatrace’s Open-Source Initiative

Dynatrace

Dynatrace’s OneAgent automatically captures PurePaths and analyzes transactions end-to-end across every tier of your application technology stack with no code changes, from the browser all the way down to the code and database level. Monitoring-as-code requirements at Dynatrace. A GitOps approach to observability.

article thumbnail

Code-level observability for Flutter apps drives great user experience

Dynatrace

By adding Flutter support, we’re giving you more freedom to choose what best fits your use case and available resources. Be sure to fine-tune the anomaly detection settings for your mobile app so that you can focus on those anomalies that are most relevant to the experience of your end users.

Code 181