Remove Availability Remove Code Remove Event Remove Metrics
article thumbnail

Efficient SLO event integration powers successful AIOps

Dynatrace

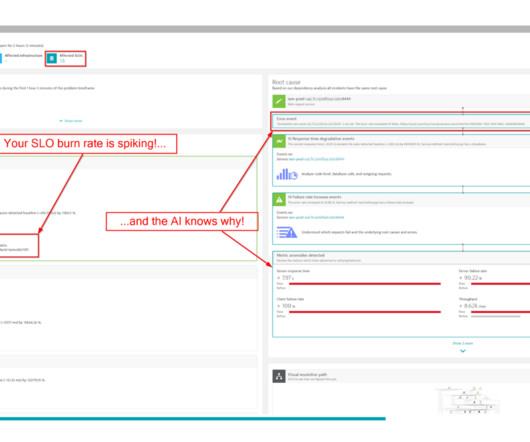
The first part of this blog post briefly explores the integration of SLO events with AI. Consequently, the AI is founded upon the related events, and due to the detection parameters (threshold, period, analysis interval, frequent detection, etc), an issue arose. In other words, where the application code resides.

article thumbnail

Dynatrace simplifies OpenTelemetry metric collection for context-aware AI analytics

Dynatrace

The release candidate of OpenTelemetry metrics was announced earlier this year at Kubecon in Valencia, Spain. Since then, organizations have embraced OTLP as an all-in-one protocol for observability signals, including metrics, traces, and logs, which will also gain Dynatrace support in early 2023.

Analytics 283
Insiders

Sign Up for our Newsletter

This site is protected by reCAPTCHA and the Google Privacy Policy and Terms of Service apply.

Trending Sources

article thumbnail

Dynatrace enhances Business Analytics with business events powered by Grail

Dynatrace

Business events powered by our new Grail™ data lakehouse and by other Dynatrace platform technologies ensures the real-time precision that business and IT teams need to make data-driven decisions and improve business outcomes. Business events deliver the industry’s broadest, deepest, and easiest access to your critical business data.

Analytics 232
article thumbnail

The value of business events: How IT can increase business agility

Dynatrace

Business events are a special class of events, new to Business Analytics; together with Grail, our data lakehouse, they provide the precision and advanced analytics capabilities required by your most important business use cases. What are business events? This diagram shows a few examples of business events.

Analytics 229
article thumbnail

In Defence of DOM­Content­Loaded

CSS Wizardry

I never thought I’d write an article in defence of DOMContentLoaded , but here it is… For many, many years now, performance engineers have been making a concerted effort to move away from technical metrics such as Load , and toward more user-facing, UX metrics such as Speed Index or Largest Contentful Paint. Or are they…?

Metrics 326
article thumbnail

How to collect Prometheus metrics in Dynatrace

Dynatrace

Dynatrace has recently extended its Kubernetes operator by adding a new feature, the Prometheus OpenMetrics Ingest , which enables you to import Prometheus metrics in Dynatrace and build SLO and anomaly detection dashboards with Prometheus data. Here we’ll explore how to collect Prometheus metrics and what you can achieve with them.

Metrics 203
article thumbnail

Extend visibility into workload and cluster health by leveraging native Kubernetes events

Dynatrace

In many cases, events are generated as these workloads go through different phases of their life cycles. For instance, events appear when the scheduler performs actions to bring workloads back to a desired state. For better or worse, every Kubernetes user learns about the CrashLoopBackOff and ImagePullBackOff events.

Metrics 229