Remove Availability Remove Cloud Remove Metrics Remove Open Source
article thumbnail

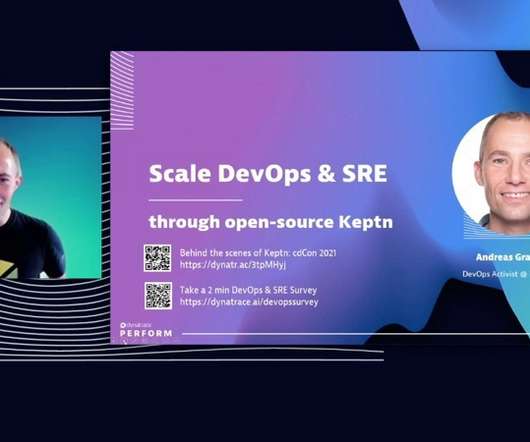
Scale DevOps and SRE with open source Keptn

Dynatrace

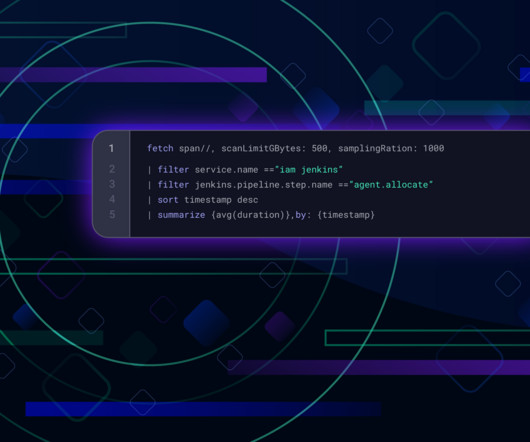
Andreas Grabner, DevOps Activist at Dynatrace, took to the virtual stage at the recent Dynatrace Perform conference to describe how the open source Keptn project automates the configuration of observability tools, dashboards, and alerting based on service-level objectives (SLOs). Why is automated orchestration critical?

article thumbnail

Dynatrace simplifies OpenTelemetry metric collection for context-aware AI analytics

Dynatrace

The release candidate of OpenTelemetry metrics was announced earlier this year at Kubecon in Valencia, Spain. Since then, organizations have embraced OTLP as an all-in-one protocol for observability signals, including metrics, traces, and logs, which will also gain Dynatrace support in early 2023.

Analytics 269
Insiders

Sign Up for our Newsletter

This site is protected by reCAPTCHA and the Google Privacy Policy and Terms of Service apply.

Trending Sources

article thumbnail

Performance Testing with Open Source Tools – Myths and Reality

Alex Podelko

Some time ago Federico Toledo published Performance Testing with Open Source Tools- Busting The Myths. Otherwise we wouldn’t see so many commercial tools built on the top of open source including BlazeMeter (it is ironic that the article is posted on the BlazeMeter site), Flood, and OctoPerf.

article thumbnail

What is observability? Not just logs, metrics and traces

Dynatrace

As dynamic systems architectures increase in complexity and scale, IT teams face mounting pressure to track and respond to conditions and issues across their multi-cloud environments. Observability relies on telemetry derived from instrumentation that comes from the endpoints and services in your multi-cloud computing environments.

Metrics 363
article thumbnail

Five-nines availability: Always-on infrastructure delivers system availability during the holidays’ peak loads

Dynatrace

The nirvana state of system uptime at peak loads is known as “five-nines availability.” In its pursuit, IT teams hover over system performance dashboards hoping their preparations will deliver five nines—or even four nines—availability. But is five nines availability attainable? Downtime per year. 90% (one nine).

article thumbnail

Observability engineering: Getting Prometheus metrics right for Kubernetes with Dynatrace and Kepler

Dynatrace

For busy site reliability engineers, ensuring system reliability, scalability, and overall health is an imperative that’s getting harder to achieve in ever-expanding, cloud-native, container-based environments. To get a more granular look into telemetry data, many analysts rely on custom metrics using Prometheus.

Metrics 169
article thumbnail

Accelerate your cloud journey with Dynatrace observability for AWS S3 logs

Dynatrace

Logs complement metrics and enable automation Cloud practitioners agree that observability, security, and automation go hand in hand. The increasing complexity of cloud service architectures requires a rock-solid understanding of the activity, health status, and security of cloud services.

AWS 187