Remove Analytics Remove Latency Remove Metrics Remove Traffic
article thumbnail

Implementing service-level objectives to improve software quality

Dynatrace

By implementing service-level objectives, teams can avoid collecting and checking a huge amount of metrics for each service. First, it helps to understand that applications and all the services and infrastructure that support them generate telemetry data based on traffic from real users. So how can teams start implementing SLOs?

Software 264
article thumbnail

Build and operate multicloud FaaS with enhanced, intelligent end-to-end observability

Dynatrace

For example, to handle traffic spikes and pay only for what they use. Scale automatically based on the demand and traffic patterns. Higher latency and cold start issues due to the initialization time of the functions. Observability is typically achieved by collecting three types of data from a system, metrics, logs and traces.

Insiders

Sign Up for our Newsletter

This site is protected by reCAPTCHA and the Google Privacy Policy and Terms of Service apply.

Trending Sources

article thumbnail

How digital experience monitoring helps deliver business observability

Dynatrace

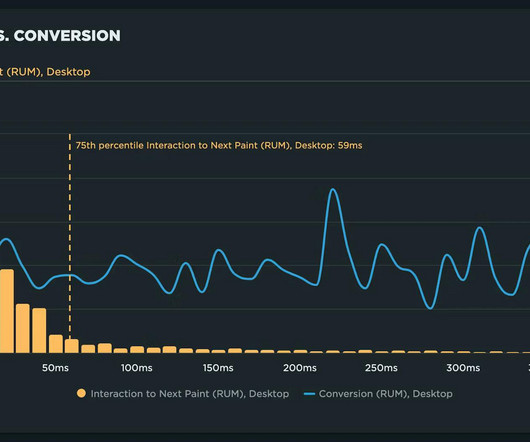
Fast, consistent application delivery creates a positive user experience that can ultimately drive customer loyalty and improve business metrics like conversion rate and user retention. It is proactive monitoring that simulates traffic with established test variables, including location, browser, network, and device type.

article thumbnail

Data Reprocessing Pipeline in Asset Management Platform @Netflix

The Netflix TechBlog

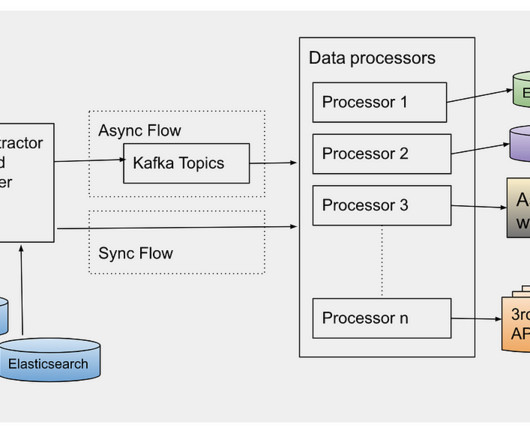
Production Use Cases Real-Time APIs (backed by the Cassandra database) for asset metadata access don’t fit analytics use cases by data science or machine learning teams. Existing data got updated to be backward compatible without impacting the existing running production traffic. Error Handling Errors are part of software development.

Media 237
article thumbnail

The road to observability demo part 3: Collect, instrument, and analyze telemetry data automatically with Dynatrace

Dynatrace

Making applications observable—relying on metrics, logs, and traces to understand what software is doing and how it’s performing—has become increasingly important as workloads are shifting to multicloud environments. We also introduced our demo app and explained how to define the metrics and traces it uses.

Metrics 171
article thumbnail

DevOps automation: From event-driven automation to answer-driven automation [with causal AI]

Dynatrace

Observability data provides a treasure trove of performance, stability, and user experience metrics encompassing error rates, response times, and user engagement. With swift precision, an answer-driven automation solution that uses causal AI can transform these metrics into invaluable insights.

DevOps 220
article thumbnail

MySQL Key Performance Indicators (KPI) With PMM

Percona

This includes metrics such as query execution time, the number of queries executed per second, and the utilization of query cache and adaptive hash index. That said, it should also be monitored for usage, which will exhibit the traffic pressuring them. One of the possible improvements in lag would be utilizing Parallel Replication.