Remove Analytics Remove Document Remove Efficiency Remove Metrics
article thumbnail

Expanded Grail data lakehouse and new Dynatrace user experience unlock boundless analytics

Dynatrace

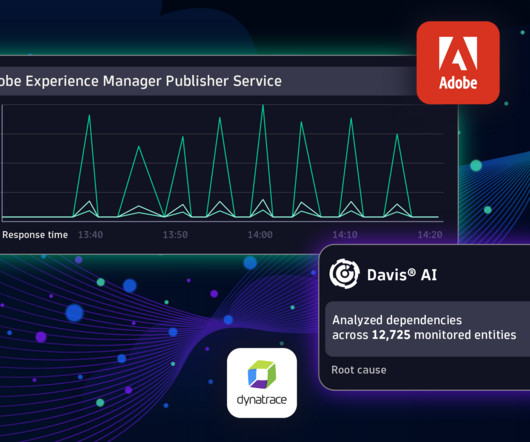
Grail – the foundation of exploratory analytics Grail can already store and process log and business events. Now we’re adding Smartscape to DQL and two new data sources to Grail: Metrics on Grail and Traces on Grail. With Dynatrace and Smartscape for DQL, metrics are a completely different game.

Analytics 235
article thumbnail

Any analysis, any time: Dynatrace Log Management and Analytics powered by Grail

Dynatrace

Log management and analytics is an essential part of any organization’s infrastructure, and it’s no secret the industry has suffered from a shortage of innovation for several years. Several pain points have made it difficult for organizations to manage their data efficiently and create actual value.

Analytics 240
Insiders

Sign Up for our Newsletter

This site is protected by reCAPTCHA and the Google Privacy Policy and Terms of Service apply.

Trending Sources

article thumbnail

Stream logs to Dynatrace with Amazon Data Firehose to boost your cloud-native journey

Dynatrace

Real-time streaming needs real-time analytics As enterprises move their workloads to cloud service providers like Amazon Web Services, the complexity of observing their workloads increases. Log data—the most verbose form of observability data, complementing other standardized signals like metrics and traces—is especially critical.

Cloud 257
article thumbnail

What is IT operations analytics? Extract more data insights from more sources

Dynatrace

With 99% of organizations using multicloud environments , effectively monitoring cloud operations with AI-driven analytics and automation is critical. IT operations analytics (ITOA) with artificial intelligence (AI) capabilities supports faster cloud deployment of digital products and services and trusted business insights.

Analytics 193
article thumbnail

Discover the power of the Dynatrace platform on Azure with Azure Native Dynatrace Service

Dynatrace

One-click activation of log collection and Azure Monitor metric collection in the Microsoft Azure Portal allows instant ingest of Azure Monitor logs and metrics into the Dynatrace platform. Notebooks offers advanced Azure observability analytics with DQL. There’s no need for configuration or setup of any infrastructure.

Azure 221
article thumbnail

Automate complex metric-related use cases with the Metrics API version 2

Dynatrace

Dynatrace collects a huge number of metrics for each OneAgent-monitored host in your environment. Depending on the types of technologies you’re running on individual hosts, the average number of metrics is about 500 per computational node. Running metric queries on a subset of entities for live monitoring and system overviews.

Metrics 231
article thumbnail

Business Flow: Why IT operations teams should monitor business processes

Dynatrace

If you can collect the relevant data (and that’s a big if), the problem shifts to analytics. Connecting data from different systems, stitching process steps together, calculating delays between steps, alerting on business exceptions and technical issues, and tracking SLOs are just some of the requirements for an effective analytics solution.