Remove Analytics Remove Availability Remove Metrics Remove Tuning
article thumbnail

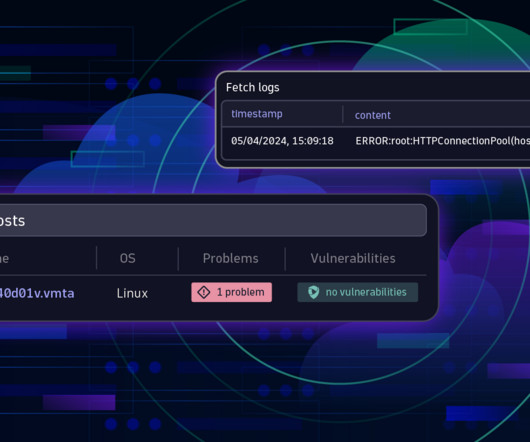
Data lakehouse innovations advance the three pillars of observability for more collaborative analytics

Dynatrace

The short answer: The three pillars of observability—logs, metrics, and traces—converging on a data lakehouse. Grail combines the big-data storage of a data warehouse with the analytical flexibility of a data lake. With Grail, we have reinvented analytics for converged observability and security data,” Greifeneder says.

Analytics 188
article thumbnail

Flexible, scalable, self-service Kubernetes native observability now in General Availability

Dynatrace

From a cost perspective, internal customers waste valuable time sending tickets to operations teams asking for metrics, logs, and traces to be enabled. A team looking for metrics, traces, and logs no longer needs to file a ticket to get their app monitored in their own environments. This approach is costly and error prone.

Insiders

Sign Up for our Newsletter

This site is protected by reCAPTCHA and the Google Privacy Policy and Terms of Service apply.

Trending Sources

article thumbnail

Automate complex metric-related use cases with the Metrics API version 2

Dynatrace

Dynatrace collects a huge number of metrics for each OneAgent-monitored host in your environment. Depending on the types of technologies you’re running on individual hosts, the average number of metrics is about 500 per computational node. Running metric queries on a subset of entities for live monitoring and system overviews.

Metrics 229
article thumbnail

Why log monitoring and log analytics matter in a hyperscale world

Dynatrace

Log monitoring, log analysis, and log analytics are more important than ever as organizations adopt more cloud-native technologies, containers, and microservices-based architectures. What is log analytics? Log analytics is the process of evaluating and interpreting log data so teams can quickly detect and resolve issues.

Analytics 211
article thumbnail

Announcing enterprise-grade observability at scale for your OpenTelemetry custom metrics

Dynatrace

As the application owner of an e-commerce application, for example, you can enrich the source code of your application with domain-specific knowledge by adding actionable semantics to collected performance or business metrics. New OpenTelemetry metrics exporters provide the broadest language support on the market.

Metrics 151
article thumbnail

Dynatrace partners with AWS to provide enterprise-grade, intelligent observability for custom OpenTelemetry metrics

Dynatrace

OpenTelemetry metrics are useful for augmenting the fully automatic observability that can be achieved with Dynatrace OneAgent. OpenTelemetry metrics add domain specific data such as business KPIs and license relevant consumption details. Enterprise-grade observability for custom OpenTelemetry metrics from AWS. Dynatrace news.

AWS 178
article thumbnail

Actionable insights with our Adobe Analytics integration and new web properties (referrer, UTM…)

Dynatrace

While Dynatrace provides software intelligence to accelerate your company’s digital transformation, web analytics tools like Adobe Analytics help you deeply understand your user journeys, segmentation, behavior, and strategic business metrics such as revenue, orders, and conversion goals. Google Analytics.

Analytics 147