

AI-driven analysis of Spring Micrometer metrics in context, with typology at scale
Dynatrace
APRIL 7, 2022
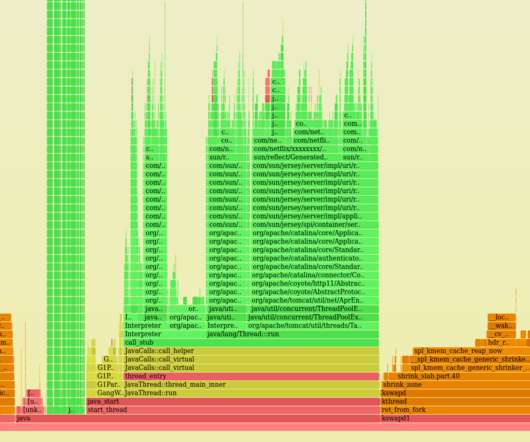
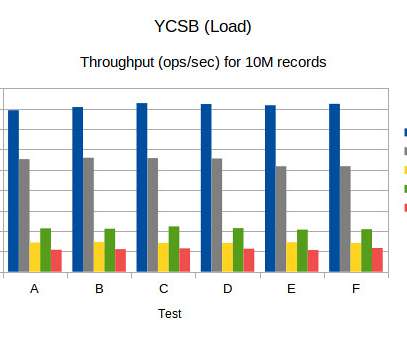
Spring Boot 2 uses Micrometer as its default application metrics collector and automatically registers metrics for a wide variety of technologies, like JVM, CPU Usage, Spring MVC, and WebFlux request latencies, cache utilization, data source utilization, Rabbit MQ connection factories, and more. This enables deep explorative analysis.


Let's personalize your content