Remove Media Remove Metrics Remove Retail Remove Speed
article thumbnail

Industry page speed benchmarks (March 2022)

Speed Curve

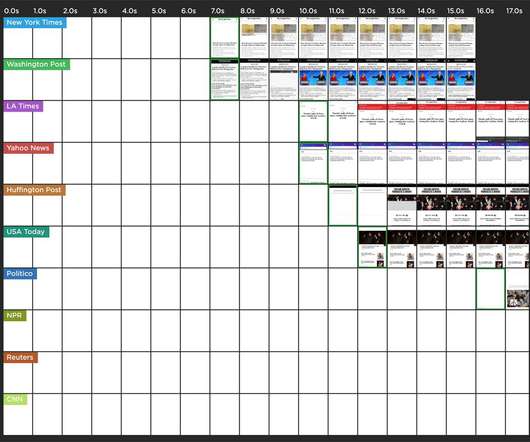
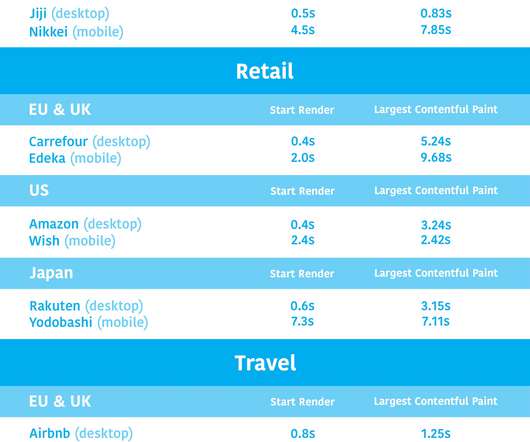
Page Speed Benchmarks is an interactive dashboard that lets you explore and compare web performance data for leading websites across several industries – from retail to media – over the past year. Key metrics. These visuals are a great tool for validating the best metrics to focus on for your pages.

article thumbnail

The new normal of digital experience delivery – lessons learned from monitoring mission-critical websites during COVID-19

Dynatrace

Over the last two month s, w e’ve monito red key sites and applications across industries that have been receiving surges in traffic , including government, health insurance, retail, banking, and media. Media p erformance . Watching media sites including CNN, Fox News, and CNBC has been very interesting.

Website 215
Insiders

Sign Up for our Newsletter

This site is protected by reCAPTCHA and the Google Privacy Policy and Terms of Service apply.

Trending Sources

article thumbnail

To understand the risks posed by AI, follow the money

O'Reilly

The problems fostered by social media, search, and recommendation algorithms was never an engineering issue, but one of financial incentives (of profit growth) not aligning with algorithms’ safe, effective, and equitable deployment. User preferences were downgraded in algorithmic importance in favour of more profitable content.

article thumbnail

2022 in review: New dashboards, Core Web Vitals enhancements, third-party tracking & more!

Speed Curve

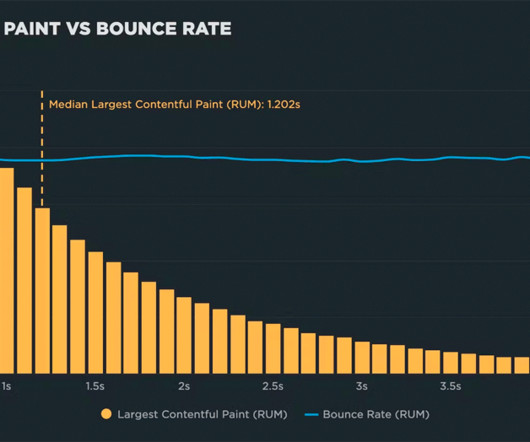
You can see at a glance: Key metrics like Core Web Vitals and your User Happiness score. Here you can still find time series charts that show how performance is trending over time across a number of key metrics, including Core Web Vitals. Fixing high-traffic but poor-performing areas of your site will help lift your overall metrics.

article thumbnail

Hero Rendering Times: New metrics for measuring UX

Speed Curve

That's why we're very excited to introduce Hero Rendering Times, a set of new metrics for measuring the user experience. These metrics are available right now to SpeedCurve users. A brief history of UX metrics. Then Speed Index came along. Speed Index is based on measuring when visual content (e.g.,

Metrics 49
article thumbnail

An Opinionated Guide to Performance Budgets

Speed Curve

Web pages are unbelievably complex, and there are hundreds of different metrics available to track. A performance budget is a threshold that you apply to the metrics you care about the most. This is when you run into three important questions: Which metrics should you focus on? Which metrics should you focus on?

article thumbnail

Cumulative Layout Shift: What it measures, when it works (and doesn't), and how to use it

Speed Curve

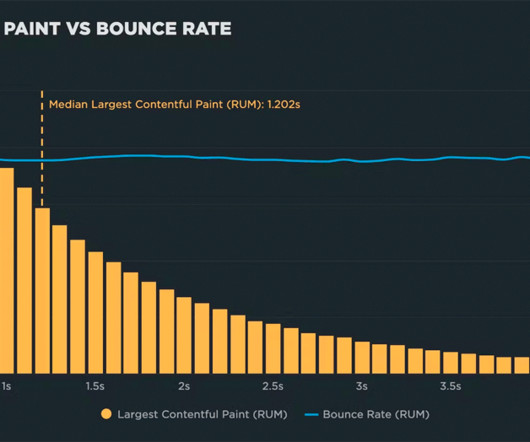
The newcomer to the scene was Cumulative Layout Shift (CLS), and, not surprisingly, it's the metric that's gotten the most questions. Does it correlate to user behaviour or business metrics in any measurable way? While I understand why score-based metrics add value, I'm a visual person. How is it calculated? is considered poor.

Retail 81