Remove Java Remove Metrics Remove Tuning
article thumbnail

Transform mainframe applications into z/OS Java services with end-to-end transaction visibility and anomaly detection (Preview)

Dynatrace

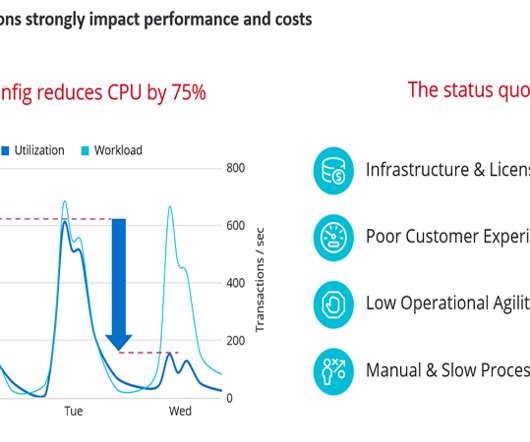
Although these COBOL applications operate with consistent performance, companies and governments are forced to transform them to new platforms and rewrite them in modern programming languages (like Java) for several reasons. Thus, implementing applications in Java can result in considerable financial savings.

Java 197
article thumbnail

Extend infrastructure observability with JMX Extensions and additional full-stack metrics

Dynatrace

To provide you with more value when monitoring hosts in infrastructure mode, we’re extending our infrastructure mode with a range of metrics that have until now only been available in full-stack mode. Monitor any infrastructure component and backing service that’s written in Java. Monitor additional metrics.

Insiders

Sign Up for our Newsletter

This site is protected by reCAPTCHA and the Google Privacy Policy and Terms of Service apply.

article thumbnail

A guide to Autonomous Performance Optimization

Dynatrace

If you want to see a more hands-on approach, I encourage you to watch the recording as Stefano did a live demo of Akamas’s integration with Dynatrace, showing how to minimize the footprint of a Java application with automated JVM tuning. Akamas also enables you to automate the analysis of the experiment metrics in powerful ways.

article thumbnail

Dynatrace adds OpenTelemetry trace ingest for open, automatic, and intelligent observability

Dynatrace

As such, we recently opened up our platform for metric ingestion and log monitoring and built integrations for key formats in those spaces. Stay tuned for the general availability of trace ingest. We’re also working on expanding OneAgent OpenTelemetry capabilities with language support for Java and.NET. What’s next.

Cloud 264
article thumbnail

OTel contributor Q&A: Dynatrace works to ensure enterprise readiness for OpenTelemetry

Dynatrace

With the arrival of this release candidate (RC), the community’s focus now shifts to providing tracing RC component releases, as well as producing a metrics specification RC. I worked on providing code-level insights for Java and.NET services and applications before shifting gears and joining the OpenTelemetry community back in May 2019.

article thumbnail

Terminology matters: how to enhance user experience by aligning names with expectations

Dynatrace

NET or Java footprint (as diagnostic tools are especially useful for these). The defined metrics will show the success of this test. Stay tuned for even more improvements to diagnostic workflows in Dynatrace. Minimum of 80 unique users. Your feedback is highly appreciated. What’s next?

Testing 246
article thumbnail

World’s first and only fully automatic observability for Golang services now extended to statically linked Go applications

Dynatrace

Improve cloud platform management with deeper insights into platform metrics. Automatically monitor all important Go metrics. Upon checking the Go-specific metrics of the foxy process, a suspicious, continuous increase of goroutines can be observed. So stay tuned! Get always-on 24/7 code-level CPU profiling. Do much more.