Remove Java Remove Metrics Remove Systems Remove Traffic
article thumbnail

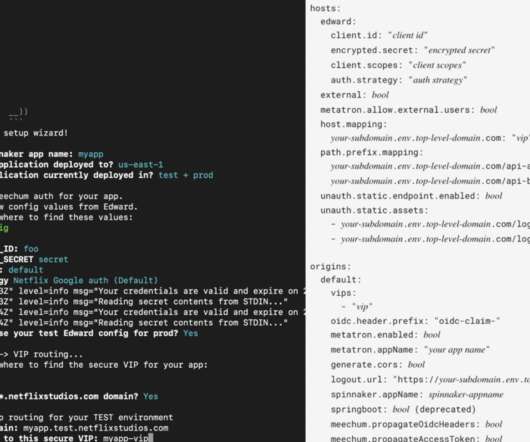
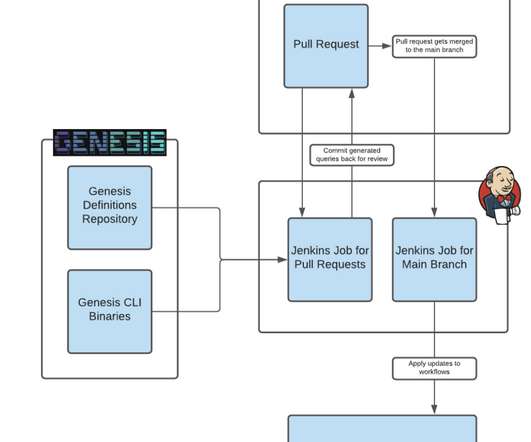
Migrating Netflix to GraphQL Safely

The Netflix TechBlog

A single API team maintained both the Java implementation of the Falcor framework and the API Server. So, we relied on higher-level metrics-based testing: AB Testing and Sticky Canaries. To determine customer impact, we could compare various metrics such as error rates, latencies, and time to render.

Traffic 353
article thumbnail

Optimizing Java XPath CPU and memory overhead by 98%

Dynatrace

Therefore, it was unsurprising to see a huge spike in traffic for Family Visa enrollment via Metrash. The system saw up to 800 application requests per second – far more than anticipated. More worrisome was a spike in CPU usage, resulting in severe service disruption as backend processing systems crashed due to the spike in load.

Java 219
Insiders

Sign Up for our Newsletter

This site is protected by reCAPTCHA and the Google Privacy Policy and Terms of Service apply.

Trending Sources

article thumbnail

The road to observability with OpenTelemetry demo part 1: Identifying metrics and traces

Dynatrace

Anyone who’s concerned with developing, delivering, and operating software knows the importance of making software and the systems it runs on observable. That is, relying on metrics, logs, and traces to understand what software is doing and where it’s running into snags. Why should I adopt observability?

Metrics 177
article thumbnail

Log auditing and log forensics benefit from converging observability and security data

Dynatrace

As organizations adopt more cloud-native technologies, observability data—telemetry from applications and infrastructure, including logs, metrics, and traces—and security data are converging. It requires an understanding of cloud architecture and distributed systems, with the goal of automating processes. Incomplete.

Analytics 182
article thumbnail

Seeing through hardware counters: a journey to threefold performance increase

The Netflix TechBlog

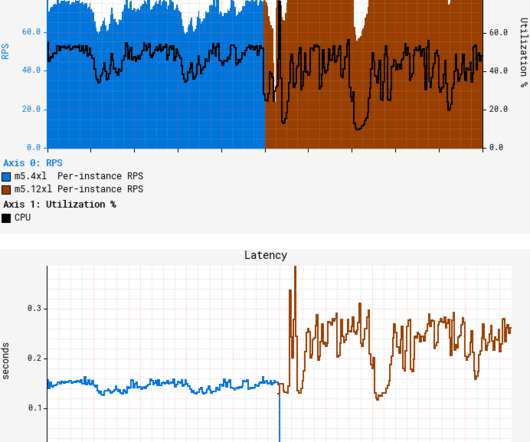
We decided to move one of our Java microservices?—?let’s A quick canary test was free of errors and showed lower latency, which is expected given that our standard canary setup routes an equal amount of traffic to both the baseline running on 4xl and the canary on 12xl. The problem It started off as a routine migration.

Hardware 363
article thumbnail

The road to observability demo part 3: Collect, instrument, and analyze telemetry data automatically with Dynatrace

Dynatrace

Making applications observable—relying on metrics, logs, and traces to understand what software is doing and how it’s performing—has become increasingly important as workloads are shifting to multicloud environments. We also introduced our demo app and explained how to define the metrics and traces it uses.

Metrics 168
article thumbnail

Kubernetes OOMKilled troubleshooting: Diagnosing out-of-memory issues automatically

Dynatrace

Robert runs a multi-tenant e-commerce system on a managed Kubernetes environment. Each tenant gets its own e-commerce site deployed on a shared Kubernetes cluster, isolated through separate namespaces and additional traffic isolation. This data confirmed that the system was killing off the report service pods for lack of memory.

Java 187