Remove Example Remove Metrics Remove Retail Remove Speed
article thumbnail

Industry page speed benchmarks (March 2022)

Speed Curve

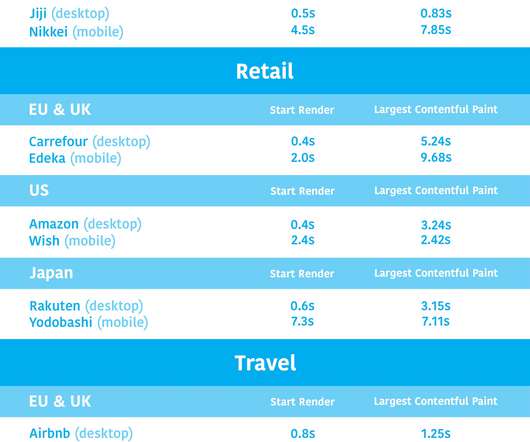
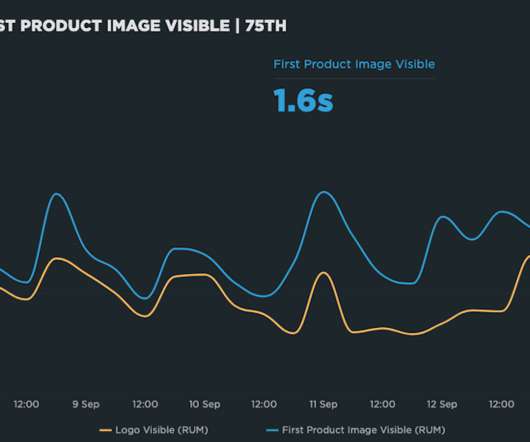
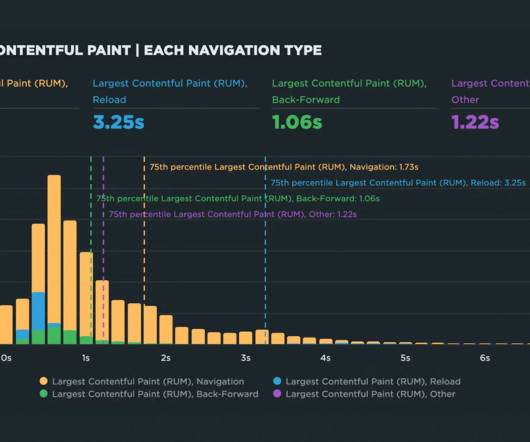
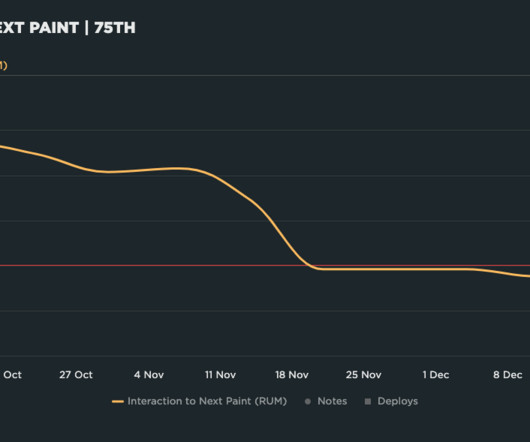
Page Speed Benchmarks is an interactive dashboard that lets you explore and compare web performance data for leading websites across several industries – from retail to media – over the past year. Key metrics. These visuals are a great tool for validating the best metrics to focus on for your pages.

article thumbnail

Site reliability done right: 5 SRE best practices that deliver on business objectives

Dynatrace

As a result, site reliability has emerged as a critical success metric for many organizations. Mobile retail e-commerce spending in the U. Microservices-based architectures and software containers enable organizations to deploy and modify applications with unprecedented speed. Service-level objectives (SLOs). availability.

Insiders

Sign Up for our Newsletter

This site is protected by reCAPTCHA and the Google Privacy Policy and Terms of Service apply.

Trending Sources

article thumbnail

What is log analytics? How a modern observability approach provides critical business insight

Dynatrace

It’s also common for teams, as part of their log monitoring practice, to write business metrics to a log that can then be tracked on a dashboard or trigger an alert. In late 2021, for example, digital forensics was central to combating the Log4Shell vulnerability. Peak performance analysis. Better-quality code. Indexing overhead.

Analytics 215
article thumbnail

The new normal of digital experience delivery – lessons learned from monitoring mission-critical websites during COVID-19

Dynatrace

Over the last two month s, w e’ve monito red key sites and applications across industries that have been receiving surges in traffic , including government, health insurance, retail, banking, and media. Retail performance . Visually complete – the time it takes for a webpage to appear fully on screen – rose from 2.68

Website 215
article thumbnail

How to use Server Timing to get backend transparency from your CDN

Speed Curve

However, that pesky 20% on the back end can have a big impact on downstream metrics like First Contentful Paint (FCP), Largest Contentful Paint (LCP), and any other 'loading' metric you can think of. That performance golden rule still holds true today. Google recommends that TTFB be 800ms at the 75th percentile.

Servers 57
article thumbnail

A retailer's guide to web performance

Speed Curve

I’m at Shop.org this week, having really interesting conversations with online retailers. Making customers happy is the not-so-secret secret to retail success. Here's an overview of the most common performance issues on retail sites, and how you can track them down and fix them. H1 Render is one of these metrics.

Retail 40
article thumbnail

What is log analytics? How a modern observability approach provides critical business insight

Dynatrace

It’s also common for teams, as part of their log monitoring practice, to write business metrics to a log that can then be tracked on a dashboard or trigger an alert. In late 2021, for example, digital forensics was central to combating the Log4Shell vulnerability. Peak performance analysis. Better-quality code. Indexing overhead.

Analytics 181