Remove Event Remove Metrics Remove Network Remove Performance
article thumbnail

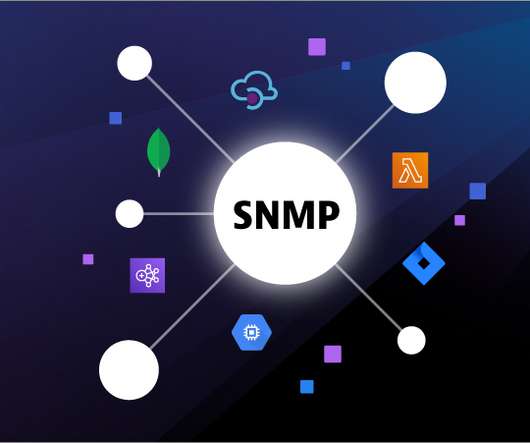
Accelerate resolution of network issues with AI-powered event reporting based on SNMP traps

Dynatrace

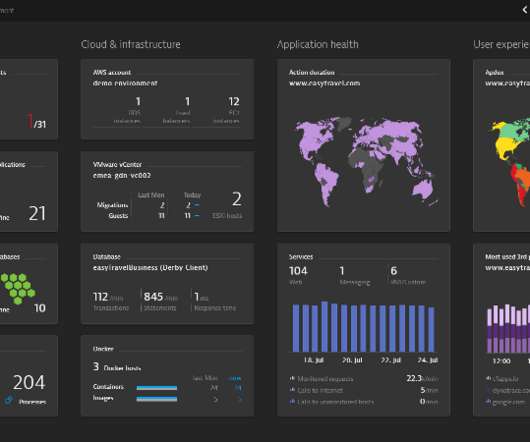
The volume of data and events grows in tandem with the rising complexity of IT infrastructure. Monitoring modern IT infrastructure is difficult, sometimes impossible, without advanced network monitoring tools. SNMP provides access to availability and performance indicators. SNMP traps can contain a variety of event-data types.

Network 221
article thumbnail

How Netflix uses eBPF flow logs at scale for network insight

The Netflix TechBlog

By Alok Tiagi , Hariharan Ananthakrishnan , Ivan Porto Carrero and Keerti Lakshminarayan Netflix has developed a network observability sidecar called Flow Exporter that uses eBPF tracepoints to capture TCP flows at near real time. Without having network visibility, it’s difficult to improve our reliability, security and capacity posture.

Network 325
Insiders

Sign Up for our Newsletter

This site is protected by reCAPTCHA and the Google Privacy Policy and Terms of Service apply.

Trending Sources

article thumbnail

How AI and observability help to safeguard government networks from new threats

Dynatrace

This is the ability to see into and measure the current state of a system based on the data it generates, which typically includes logs, metrics, traces, end-user experiences, and context across cloud, multi-cloud, and hybrid environments. This blog originally appeared in Federal News Network. First, let’s discuss observability.

article thumbnail

AI-powered DNS request tracking extends infrastructure observability for high quality network traffic

Dynatrace

Applications and services are often slowed down by under-performing DNS communications or misconfigured DNS servers, which can result in frustrated customers uninstalling your application. Ensure high quality network traffic by tracking DNS requests out-of-the-box. Identify under-performing DNS servers.

Traffic 264
article thumbnail

Observability engineering: Getting Prometheus metrics right for Kubernetes with Dynatrace and Kepler

Dynatrace

To get a more granular look into telemetry data, many analysts rely on custom metrics using Prometheus. Named after the Greek god who brought fire down from Mount Olympus, Prometheus metrics have been transforming observability since the project’s inception in 2012.

Metrics 175
article thumbnail

In Defence of DOM­Content­Loaded

CSS Wizardry

I never thought I’d write an article in defence of DOMContentLoaded , but here it is… For many, many years now, performance engineers have been making a concerted effort to move away from technical metrics such as Load , and toward more user-facing, UX metrics such as Speed Index or Largest Contentful Paint. Or are they…?

Metrics 326
article thumbnail

How to collect Prometheus metrics in Dynatrace

Dynatrace

Dynatrace has recently extended its Kubernetes operator by adding a new feature, the Prometheus OpenMetrics Ingest , which enables you to import Prometheus metrics in Dynatrace and build SLO and anomaly detection dashboards with Prometheus data. Here we’ll explore how to collect Prometheus metrics and what you can achieve with them.

Metrics 197