Remove Efficiency Remove Processing Remove Traffic Remove Tuning
article thumbnail

Bending pause times to your will with Generational ZGC

The Netflix TechBlog

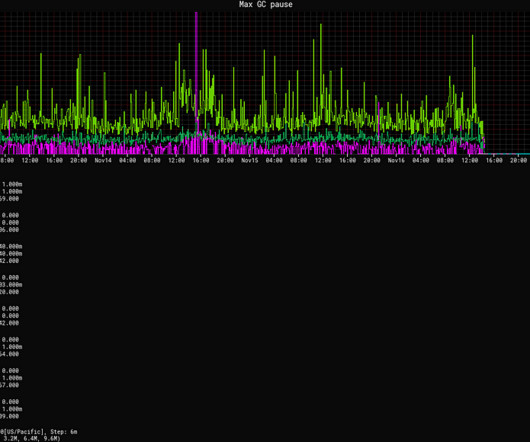
Each of these errors is a canceled request resulting in a retry so this reduction further reduces overall service traffic by this rate: Errors rates per second. Operational simplicity Service owners often reach out to us with questions about excessive pause times and for help with tuning.

Latency 228
article thumbnail

MySQL Performance Tuning 101: Key Tips to Improve MySQL Database Performance

Percona

While there is no magic bullet for MySQL performance tuning, there are a few areas that can be focused on upfront that can dramatically improve the performance of your MySQL installation. What are the Benefits of MySQL Performance Tuning? A finely tuned database processes queries more efficiently, leading to swifter results.

Tuning 52
Insiders

Sign Up for our Newsletter

This site is protected by reCAPTCHA and the Google Privacy Policy and Terms of Service apply.

Trending Sources

article thumbnail

9 key DevOps metrics for success

Dynatrace

Your next challenge is ensuring your DevOps processes, pipelines, and tooling meet the intended goal. Deployment frequency measures both long-term and short-term efficiency. For example, by measuring deployment frequency daily or weekly, you can determine how efficiently your team is responding to process changes.

DevOps 189
article thumbnail

DevOps automation: From event-driven automation to answer-driven automation [with causal AI]

Dynatrace

In the world of DevOps and SRE, DevOps automation answers the undeniable need for efficiency and scalability. This evolution in automation, referred to as answer-driven automation, empowers teams to address complex issues in real time, optimize workflows, and enhance overall operational efficiency.

DevOps 209
article thumbnail

Automated observability, security, and reliability at scale

Dynatrace

As software development grows more complex, managing components using an automated onboarding process becomes increasingly important. However, scaling up software development requires more tools along the software product lifecycle, which must be configured promptly and efficiently. The screenshot below displays such a configuration.

article thumbnail

Build and operate multicloud FaaS with enhanced, intelligent end-to-end observability

Dynatrace

For example, to handle traffic spikes and pay only for what they use. Scale automatically based on the demand and traffic patterns. Data analysis : how to process, aggregate and query observability data from serverless functions effectively, accurately, and comprehensively? Such anomalies can be caused by function cold-starts.

article thumbnail

Crucial Redis Monitoring Metrics You Must Watch

Scalegrid

Effective management of memory stores with policies like LRU/LFU proactive monitoring of the replication process and advanced metrics such as cache hit ratio and persistence indicators are crucial for ensuring data integrity and optimizing Redis’s performance. Cache Hit Ratio The cache hit ratio represents the efficiency of cache usage.

Metrics 130