Remove DevOps Remove Event Remove Metrics Remove Systems
article thumbnail

Extract metrics from business events to increase the value of business analytics

Dynatrace

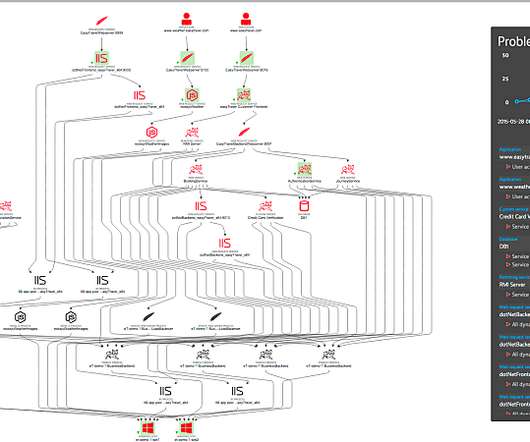
Observability fault lines The monitoring of complex and dynamic IT systems includes real-time analysis of baselines, trends, and anomalies. This is achieved, in part, by establishing actionable statistical accuracy —not necessarily precise accuracy —through practical levels of metric sampling, aggregation, and extrapolation.

Analytics 197
article thumbnail

How observability, application security, and AI enhance DevOps and platform engineering maturity

Dynatrace

DevOps and platform engineering are essential disciplines that provide immense value in the realm of cloud-native technology and software delivery. Observability of applications and infrastructure serves as a critical foundation for DevOps and platform engineering, offering a comprehensive view into system performance and behavior.

DevOps 187
Insiders

Sign Up for our Newsletter

This site is protected by reCAPTCHA and the Google Privacy Policy and Terms of Service apply.

Trending Sources

article thumbnail

Efficient SLO event integration powers successful AIOps

Dynatrace

The first part of this blog post briefly explores the integration of SLO events with AI. Consequently, the AI is founded upon the related events, and due to the detection parameters (threshold, period, analysis interval, frequent detection, etc), an issue arose. See the following example with BurnRate formula for Failure rate event.

article thumbnail

What is MTTR? How mean time to repair helps define DevOps incident management

Dynatrace

DevOps and ITOps teams rely on incident management metrics such as mean time to repair (MTTR). These metrics help to keep a network system up and running?, Other such metrics include uptime, downtime, number of incidents, time between incidents, and time to respond to and resolve an issue. So, what is MTTR?

DevOps 204
article thumbnail

Enhanced root cause analysis using events

Dynatrace

A common challenge of DevOps teams is they get overwhelmed with too many alerts from their observability tools. DevOps teams don’t need just more noise—they need smarter alerting that is automatic, accurate, and actionable with precise root cause analysis. Demo: Add the human factor using the Dynatrace events API.

DevOps 178
article thumbnail

What is log management? How to tame distributed cloud system complexities

Dynatrace

Log management is an organization’s rules and policies for managing and enabling the creation, transmission, analysis, storage, and other tasks related to IT systems’ and applications’ log data. In cloud-native environments, there can also be dozens of additional services and functions all generating data from user-driven events.

Systems 183
article thumbnail

Closed-loop remediation: Why unified observability is an essential auto-remediation best practice

Dynatrace

Closed loop” refers to the continuous feedback loop in which the system takes actions — based on monitoring and analysis — and verifies the results to ensure complete problem remediation. The goal is to either improve or restore the system to its optimally functioning state. Ideally, this all occurs without human intervention.