article thumbnail

Running the OpenTelemetry demo application with Dynatrace

Dynatrace

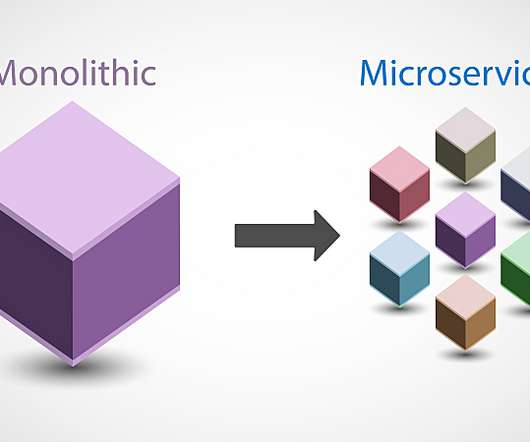
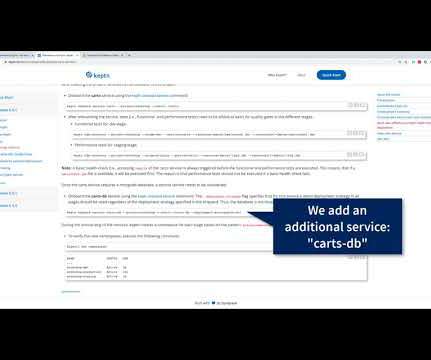
The demo has been in active development since the summer of 2022 with Dynatrace as one of its leading contributors. The demo application is a cloud-native e-commerce application made up of multiple microservices. OpenTelemetry demo application architecture diagram. By default, the demo comes with?Jaeger OpenTelemetry?community

article thumbnail

DevOps engineer tools: Deploy, test, evaluate, repeat

Dynatrace

As cloud-native, distributed architectures proliferate, the need for DevOps technologies and DevOps platform engineers has increased as well. DevOps engineer tools can help ease the pressure as environment complexity grows. ” What does a DevOps platform engineer do? A DevOps platform engineer is a more recent term.

DevOps 192
Insiders

Sign Up for our Newsletter

This site is protected by reCAPTCHA and the Google Privacy Policy and Terms of Service apply.

Trending Sources

article thumbnail

Hybrid cloud infrastructure explained: Weighing the pros, cons, and complexities

Dynatrace

More than 90% of enterprises now rely on a hybrid cloud infrastructure to deliver innovative digital services and capture new markets. That’s because cloud platforms offer flexibility and extensibility for an organization’s existing infrastructure. Dynatrace news. With public clouds, multiple organizations share resources.

article thumbnail

Unlock the Power of DevSecOps with Newly Released Kubernetes Experience for Platform Engineering

Dynatrace

The development of internal platform teams has taken off in the last three years, primarily in response to the challenges inherent in scaling modern, containerized IT infrastructures. The ability to effectively manage multi-cluster infrastructure is critical to consistent and scalable service delivery.

article thumbnail

Automate CI/CD pipelines with Dynatrace: Part 4, Validation stage

Dynatrace

This view seamlessly correlates crucial events across all affected components, eliminating the manual effort of sifting through various monitoring tools for infrastructure, process, or service metrics. In the next blog post, we’ll discuss the integration of security modules into the DevOps process with the aim of achieving DevSecOps.

DevOps 205
article thumbnail

What is full stack observability?

Dynatrace

Endpoints include on-premises servers, Kubernetes infrastructure, cloud-hosted infrastructure and services, and open-source technologies. Observability across the full technology stack gives teams comprehensive, real-time insight into the behavior, performance, and health of applications and their underlying infrastructure.

DevOps 232
article thumbnail

Dynatrace ensures continuous software quality by combining synthetic monitoring and automatic release validation

Dynatrace

It negatively affects the lead time for changes (LT) , a DORA metric 1 that DevOps teams use to measure platform and team performance. Utilizing a collection of tools for synthetic CI/CD testing can identify an issue while still leaving DevOps and SRE teams responsible for root cause analysis, which they often have to perform manually.