Remove Database Remove Monitoring Remove Servers Remove Storage
article thumbnail

Extend business observability: Extract business events from online databases (Part 2)

Dynatrace

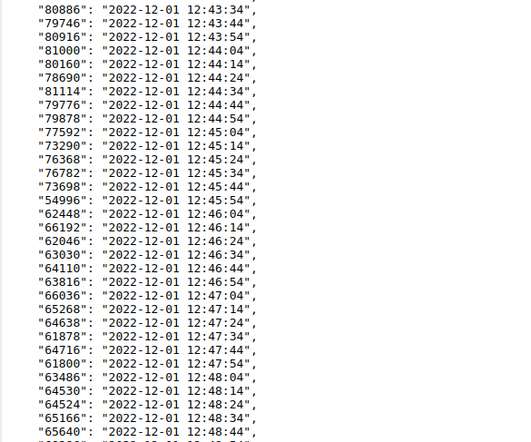
In part 2, we’ll show you how to retrieve business data from a database, analyze that data using dashboards and ad hoc queries, and then use a Davis analyzer to predict metric behavior and detect behavioral anomalies. Dynatrace users typically use extensions to pull technical monitoring data, such as device metrics, into Dynatrace.

Database 266
article thumbnail

Crucial Redis Monitoring Metrics You Must Watch

Scalegrid

Redis® is an in-memory database that provides blazingly fast performance. This makes it a compelling alternative to disk-based databases when performance is a concern. You will need to know which monitoring metrics for Redis to watch and a tool to monitor these critical server metrics to ensure its health.

Metrics 130
Insiders

Sign Up for our Newsletter

This site is protected by reCAPTCHA and the Google Privacy Policy and Terms of Service apply.

Trending Sources

article thumbnail

Reducing Your Database Hosting Costs: DigitalOcean vs. AWS vs. Azure

Scalegrid

If you’re hosting your databases in the cloud, choosing the right cloud service provider is a significant decision to make for your long-term hosting costs. Over the last few weeks, we have been inundated with requests from SMB customers looking to improve the ROI on their database hosting. MongoDB® Database. EC2 instances.

Azure 344
article thumbnail

Percona Server for MongoDB 7 Is Now Available

Percona

Databases are different from a lot of software. This is not a general rule, but as databases are responsible for a core layer of any IT system – data storage and processing — they require reliability. Why choose Percona Server for MongoDB? Why release Percona Server for MongoDB 7 now?

article thumbnail

Percona Monitoring and Management 2 Scaling and Capacity Planning

Percona

2022 was an exciting year for Percona Monitoring and Management (PMM). These updates are designed to keep databases running at peak performance and simplify database operations. PMM2 uses VictoriaMetrics (VM) as its metrics storage engine. We have tested PMM version 2.33.0

article thumbnail

What is infrastructure monitoring and why is it mission-critical in the new normal?

Dynatrace

IT infrastructure is the heart of your digital business and connects every area – physical and virtual servers, storage, databases, networks, cloud services. What is infrastructure monitoring? . What to look for when selecting an infrastructure monitoring solution? It’s not hype, it’s the way forward.

article thumbnail

Optimize your environment: Unveiling Dynatrace Hyper-V extension for enhanced performance and efficient troubleshooting

Dynatrace

Secondly, determining the correct allocation of resources (CPU, memory, storage) to each virtual machine to ensure optimal performance without over-provisioning can be difficult. Start monitoring Hyper-V Navigate to the Dynatrace Hub and activate the Microsoft Hyper-V Extension. Let us know what you think in the Dynatrace Community.