Remove Cache Remove Hardware Remove Network Remove Software
article thumbnail

Crucial Redis Monitoring Metrics You Must Watch

Scalegrid

Effective management of memory stores with policies like LRU/LFU proactive monitoring of the replication process and advanced metrics such as cache hit ratio and persistence indicators are crucial for ensuring data integrity and optimizing Redis’s performance. offers the Software Watchdog specifically designed for this purpose.

Metrics 130
article thumbnail

Software Testing Errors to look out for (with examples)

Testsigma

The software will never be bug-free. Bugs could come up due to different reasons, in this article, we will discuss them from the perspective of software errors. We can divide the errors during software development into two sections for easy understanding: Software errors Testing errors. Software errors.

Insiders

Sign Up for our Newsletter

This site is protected by reCAPTCHA and the Google Privacy Policy and Terms of Service apply.

Trending Sources

article thumbnail

Key Advantages of DBMS for Efficient Data Management

Scalegrid

It comprises a collection of interrelated data and a set of software tools that aid in the access, processing, and management of data. Types of DBMS DBMS can be classified into hierarchical, network, relational, and object-oriented types. It provides tools for organizing and retrieving data efficiently.

article thumbnail

How to Assess MySQL Performance

HammerDB

Among the different components of modern software solutions, the database is one of the most critical. As database performance is heavily influenced by the performance of storage, network, memory, and processors, we must understand the upper limit of these key components. NETWORK METRICS sysstat_net_ens260f1_rx_kB/s 38,241 22,700 1.68

article thumbnail

MySQL Key Performance Indicators (KPI) With PMM

Percona

This includes metrics such as query execution time, the number of queries executed per second, and the utilization of query cache and adaptive hash index. query cache: Disable (query_cache_size: 0, query_cache_type:OFF) innodb_adaptive_hash_index: Check adaptive hash index usage to determine its efficiency.

article thumbnail

USENIX SREcon APAC 2022: Computing Performance: What's on the Horizon

Brendan Gregg

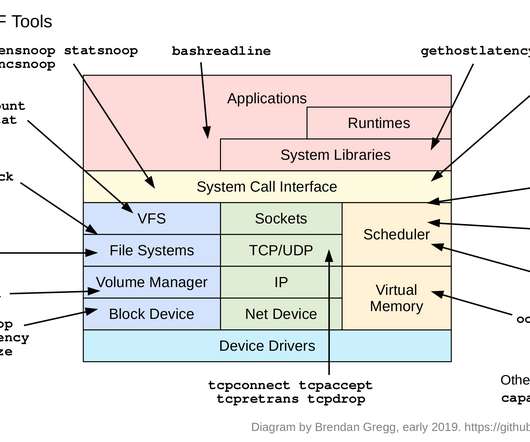
DDR6: Here's What to Expect in RAM Modules,” [link] Nov 2020 - [Salter 20] Jim Salter, “Western Digital releases new 18TB, 20TB EAMR drives,” [link] Jul 2020 - [Spier 20] Martin Spier, Brendan Gregg, et al.,

article thumbnail

Seer: leveraging big data to navigate the complexity of performance debugging in cloud microservices

The Morning Paper

When a QoS violation is predicted to occur and a culprit microservice located, Seer uses a lower level tracing infrastructure with hardware monitoring primitives to identify the reason behind the QoS violation. E.g., in memcached there are five main internal stages, each of which has a hardware or software queue associated with it.