article thumbnail

The Speed of Time

Brendan Gregg

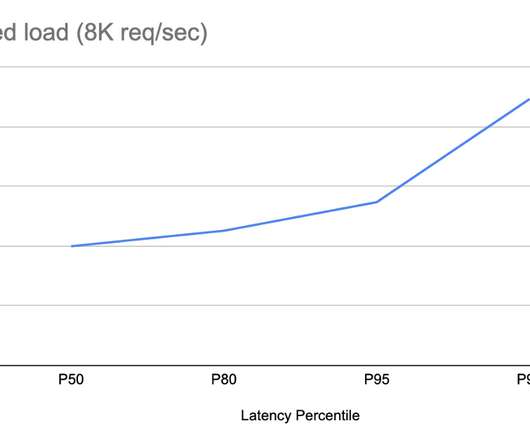
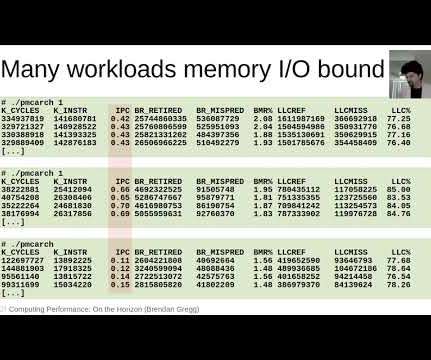
A Cassandra database cluster had switched to Ubuntu and noticed write latency increased by over 30%. Measuring the speed of time Is there already a microbenchmark for os::javaTimeMillis()? html [unroll the loop]: /blog/2014-04-26/the-noploop-cpu-benchmark.html What on Earth is Ubuntu doing that results in 30% higher CPU time!?

Speed 126
article thumbnail

Running A Page Speed Test: Monitoring vs. Measuring

Smashing Magazine

Running A Page Speed Test: Monitoring vs. Measuring Running A Page Speed Test: Monitoring vs. Measuring Geoff Graham 2023-08-10T08:00:00+00:00 2023-08-10T12:35:05+00:00 This article is sponsored by DebugBear There is no shortage of ways to measure the speed of a webpage. Lighthouse results.

Speed 81
Insiders

Sign Up for our Newsletter

This site is protected by reCAPTCHA and the Google Privacy Policy and Terms of Service apply.

Trending Sources

article thumbnail

Automated Change Impact Analysis with Site Reliability Guardian

Dynatrace

SREs use Service-Level Indicators (SLI) to see the complete picture of service availability, latency, performance, and capacity across various systems, especially revenue-critical systems. Thus, Site Reliability Guardian supports DevOps and SREs in speeding up release delivery and improving release quality.

DevOps 227
article thumbnail

Crucial Redis Monitoring Metrics You Must Watch

Scalegrid

This blog post lists the important database metrics to monitor. Key Takeaways Critical performance indicators such as latency, CPU usage, memory utilization, hit rate, and number of connected clients/slaves/evictions must be monitored to maintain Redis’s high throughput and low latency capabilities.

Metrics 130
article thumbnail

Optimizing your Kubernetes clusters without breaking the bank

Dynatrace

The Akamas vision is that only an autonomous optimization approach powered by AI can effectively enable performance engineers, SREs, and architects to identify the best configurations that ensure maximum service performance and resilience, at the lowest possible cost and at business speed. below 500ms) and error rates (e.g. lower than 2%.).

Latency 213
article thumbnail

Managing risk for financial services: The secret to visibility and control during times of volatility

Dynatrace

This blog explores how vertically integrated risk management solutions that use AI and automation enable unparalleled visibility, control, and efficiency for risk management in banking. Deploy risk-based estimates and models with confidence, accuracy, transparency, and speed. Break down data silos.

Analytics 210
article thumbnail

Consistent caching mechanism in Titus Gateway

The Netflix TechBlog

This blog post presents how our current iteration of Titus deals with high API call volumes by scaling out horizontally. In that scenario, the system would need to deal with the data propagation latency directly, for example, by use of timeouts or client-originated update tracking mechanisms. How do I know that my cache is up to date?

Cache 224