article thumbnail

Consistent caching mechanism in Titus Gateway

The Netflix TechBlog

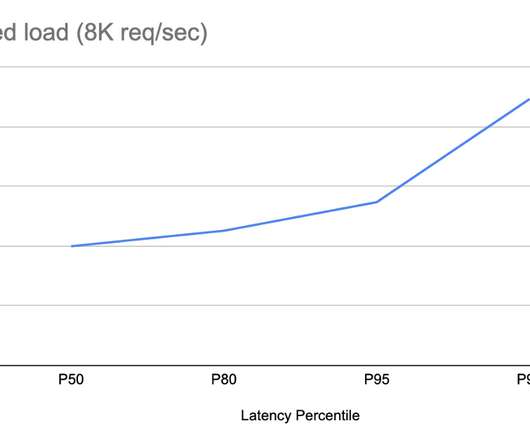
This blog post presents how our current iteration of Titus deals with high API call volumes by scaling out horizontally. We introduce a caching mechanism in the API gateway layer, allowing us to offload processing from singleton leader elected controllers without giving up strict data consistency and guarantees clients observe.

Cache 224
article thumbnail

Cache-Control for Civilians

CSS Wizardry

To this end, having a solid caching strategy can make all the difference for your visitors. ?? How is your knowledge of caching and Cache-Control headers? That being said, more and more often in my work I see lots of opportunities being left on the table through unconsidered or even completely overlooked caching practices.

Cache 264
Insiders

Sign Up for our Newsletter

This site is protected by reCAPTCHA and the Google Privacy Policy and Terms of Service apply.

Trending Sources

article thumbnail

Crucial Redis Monitoring Metrics You Must Watch

Scalegrid

This blog post lists the important database metrics to monitor. Key Takeaways Critical performance indicators such as latency, CPU usage, memory utilization, hit rate, and number of connected clients/slaves/evictions must be monitored to maintain Redis’s high throughput and low latency capabilities.

Metrics 130
article thumbnail

Migrating Netflix to GraphQL Safely

The Netflix TechBlog

This blog post will share broadly-applicable techniques (beyond GraphQL) we used to perform this migration. And we definitely couldn’t replay test non-functional requirements like caching and logging user interaction. To determine customer impact, we could compare various metrics such as error rates, latencies, and time to render.

Traffic 353
article thumbnail

Dynatrace accelerates business transformation with new AI observability solution

Dynatrace

This blog post explores how AI observability enables organizations to predict and control costs, performance, and data reliability. Data dependencies and framework intricacies require observing the lifecycle of an AI-powered application end to end, from infrastructure and model performance to semantic caches and workflow orchestration.

Cache 212
article thumbnail

AI-driven analysis of Spring Micrometer metrics in context, with typology at scale

Dynatrace

Spring Boot 2 uses Micrometer as its default application metrics collector and automatically registers metrics for a wide variety of technologies, like JVM, CPU Usage, Spring MVC, and WebFlux request latencies, cache utilization, data source utilization, Rabbit MQ connection factories, and more. That’s a large amount of data to handle.

Metrics 216
article thumbnail

Migrating Critical Traffic At Scale with No Downtime?—?Part 1

The Netflix TechBlog

This blog series will examine the tools, techniques, and strategies we have utilized to achieve this goal. This blog post will provide a detailed analysis of replay traffic testing, a versatile technique we have applied in the preliminary validation phase for multiple migration initiatives.

Traffic 339