article thumbnail

Introducing Page Speed Benchmarks – a new resource for the performance community

Speed Curve

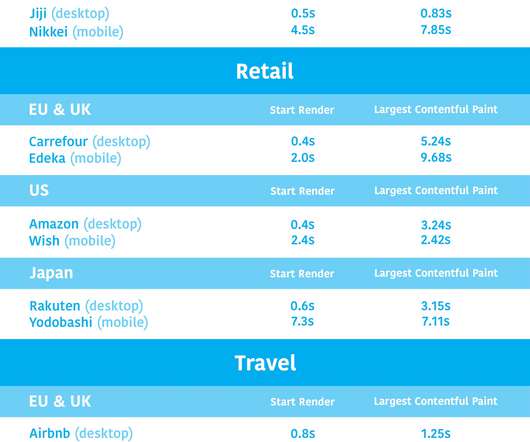
What are some good sites I can use for benchmarking? Page Speed Benchmarks is an interactive dashboard that lets you explore and compare web performance data for leading websites across several industries – from retail to media. Identify sites you can use for your own competitive benchmarking.

article thumbnail

Industry page speed benchmarks (March 2022)

Speed Curve

Page Speed Benchmarks is an interactive dashboard that lets you explore and compare web performance data for leading websites across several industries – from retail to media – over the past year. Largest Contentful Paint – When the largest element – usually image or video – in the viewport is rendered.

Insiders

Sign Up for our Newsletter

This site is protected by reCAPTCHA and the Google Privacy Policy and Terms of Service apply.

Trending Sources

article thumbnail

Optimizing Video For Size And Quality

Smashing Magazine

Optimizing Video For Size And Quality. Optimizing Video For Size And Quality. Over the last few years, more and more projects are using video as an integral part of the application. However, it all goes sideways when there are issues related to the video playback. Doug Sillars. 2021-02-15T15:00:00+00:00. Real-World Data.

Network 143
article thumbnail

2023 Black Friday and Cyber Monday retail and e-commerce IT performance observations

Dynatrace

Social media was relatively quiet, and as always, the Dynatrace Insights team was benchmarking key retailer home pages from mobile and desktop perspectives. This had the effect of dramatically speeding up its performance and reducing support costs. This video (below) illustrates my experience.

Retail 222
article thumbnail

Web Performance for Product Managers

Speed Curve

This includes: waterfall charts with details about every request, filmstrips and videos that help you visualize the rendering experience, and. Synthetic is great for trending over time, especially when looking at the number and size of requests (images, JavaScript, CSS), which collectively have a big impact on speed.

article thumbnail

2022 in review: New dashboards, Core Web Vitals enhancements, third-party tracking & more!

Speed Curve

Jumped into in-person events, and were so happy to catch up with some of you at SmashingConf and performance.now() (You can watch videos of my talk about performance budgets and Andy Davies' talk about third parties.). Your current competitive benchmarks status. Expanded Industry Speed Benchmarks. Lots of new videos!

article thumbnail

New web performance insights with additional metrics and enhanced Visually complete for synthetic monitors

Dynatrace

These metrics are tightly connected to the perceived load speed of your application. This is definitely a great starting benchmark against which to optimize your application. Note : The changes and improvements to Visually complete can potentially impact your Visually complete, Speed index, and User action duration baselines.

Metrics 217