Remove Availability Remove Metrics Remove Network Remove Systems
article thumbnail

Five-nines availability: Always-on infrastructure delivers system availability during the holidays’ peak loads

Dynatrace

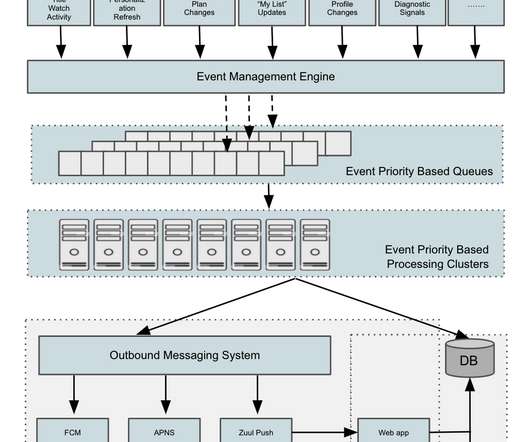
The nirvana state of system uptime at peak loads is known as “five-nines availability.” In its pursuit, IT teams hover over system performance dashboards hoping their preparations will deliver five nines—or even four nines—availability. But is five nines availability attainable? Downtime per year. 90% (one nine).

article thumbnail

How Netflix uses eBPF flow logs at scale for network insight

The Netflix TechBlog

By Alok Tiagi , Hariharan Ananthakrishnan , Ivan Porto Carrero and Keerti Lakshminarayan Netflix has developed a network observability sidecar called Flow Exporter that uses eBPF tracepoints to capture TCP flows at near real time. Without having network visibility, it’s difficult to improve our reliability, security and capacity posture.

Network 325
Insiders

Sign Up for our Newsletter

This site is protected by reCAPTCHA and the Google Privacy Policy and Terms of Service apply.

Trending Sources

article thumbnail

How AI and observability help to safeguard government networks from new threats

Dynatrace

This is further exacerbated by the fact that a significant portion of their IT budgets are allocated to maintaining outdated legacy systems. By combining AI and observability, government agencies can create more intelligent and responsive systems that are better equipped to tackle the challenges of today and tomorrow.

article thumbnail

Rapid Event Notification System at Netflix

The Netflix TechBlog

To this end, we developed a Rapid Event Notification System (RENO) to support use cases that require server initiated communication with devices in a scalable and extensible manner. In this blog post, we will give an overview of the Rapid Event Notification System at Netflix and share some of the learnings we gained along the way.

Systems 334
article thumbnail

Observability engineering: Getting Prometheus metrics right for Kubernetes with Dynatrace and Kepler

Dynatrace

For busy site reliability engineers, ensuring system reliability, scalability, and overall health is an imperative that’s getting harder to achieve in ever-expanding, cloud-native, container-based environments. To get a more granular look into telemetry data, many analysts rely on custom metrics using Prometheus.

Metrics 183
article thumbnail

Crucial Redis Monitoring Metrics You Must Watch

Scalegrid

You will need to know which monitoring metrics for Redis to watch and a tool to monitor these critical server metrics to ensure its health. Redis returns a big list of database metrics when you run the info command on the Redis shell. You can pick a smart selection of relevant metrics from these.

Metrics 130
article thumbnail

9 key DevOps metrics for success

Dynatrace

As we look at today’s applications, microservices, and DevOps teams, we see leaders are tasked with supporting complex distributed applications using new technologies spread across systems in multiple locations. The emerging concepts of working with DevOps metrics and DevOps KPIs have really come a long way. Deployment frequency.

DevOps 206