Remove Availability Remove Example Remove Infrastructure Remove Network
article thumbnail

Trace, diagnose, resolve: Introducing the Infrastructure & Operations app for streamlined troubleshooting

Dynatrace

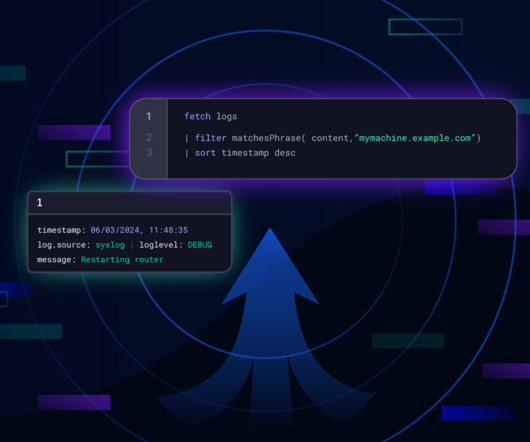
Infrastructure and operations teams must maintain infrastructure health for IT environments. For example, an unnoticed database strain could slow down the response time of a web frontend, resulting in poor user experience. For the most granular metrics and network insights, OneAgent is the optimal choice.

article thumbnail

Vulnerability assessment: key to protecting applications and infrastructure

Dynatrace

Protecting IT infrastructure, applications, and data requires that you understand security weaknesses attackers can exploit. Examples of such weaknesses are errors in application code, misconfigured network devices, and overly permissive access controls in a database. Dynatrace news.

Insiders

Sign Up for our Newsletter

This site is protected by reCAPTCHA and the Google Privacy Policy and Terms of Service apply.

Trending Sources

article thumbnail

Bring syslog into Dynatrace using OpenTelemetry to get open source value with enterprise support

Dynatrace

Getting insights into the health and disruptions of your networking or infrastructure is fundamental to enterprise observability. Even for a supported component, delivering logs from applications and infrastructure to DevSecBizOps workflows requires significant manual configuration. Take a look at this example for configuration.

article thumbnail

AI-powered infrastructure monitoring for your SAP HANA database (Preview)

Dynatrace

For example, you can get comprehensive monitoring of SAP ABAP Systems , which lowers the barrier of communication between enterprise IT operations and SAP Basis teams. Captured metrics include infrastructure measures (CPU, Disk, and Network metrics) as well as details related to Backups, Savepoints, Replication, and more.

article thumbnail

Extend infrastructure observability with JMX Extensions and additional full-stack metrics

Dynatrace

Infrastructure exists to support the backing services that are collectively perceived by users to be your web application. Issues that manifest themselves as performance degradation on a user’s device can often be traced back to underlying infrastructure issues. Dynatrace news. Monitor additional metrics.

article thumbnail

Stream logs to Dynatrace with Amazon Data Firehose to boost your cloud-native journey

Dynatrace

Without the ability to see the logs that are relevant to your service, infrastructure, or cloud function—at exactly the right time and in exactly the right format—your cloud or DevOps engineers lose the ability to find the root causes of the issues they troubleshoot. Managing this change is difficult. Now, you can set up your Firehose stream.

Cloud 251
article thumbnail

Comparing Approaches to Durability in Low Latency Messaging Queues

DZone

A significant feature of Chronicle Queue Enterprise is support for TCP replication across multiple servers to ensure the high availability of application infrastructure. This is the first time I have benchmarked it with a realistic example. Little’s Law and Why Latency Matters.

Latency 275