Remove Availability Remove Code Remove Java Remove Metrics
article thumbnail

Unmatched scalability and security of Dynatrace extensions now available for all supported technologies: 7 reasons to migrate your JMX and Python plugins

Dynatrace

focused on technology coverage, building on the flexibility of JMX for Java and Python-based coded extensions for everything else. While Python code can address most data acquisition and ingest requirements, it comes at the cost of complexity in implementation and use-case modeling. Comprehensive metrics support Extensions 2.0

article thumbnail

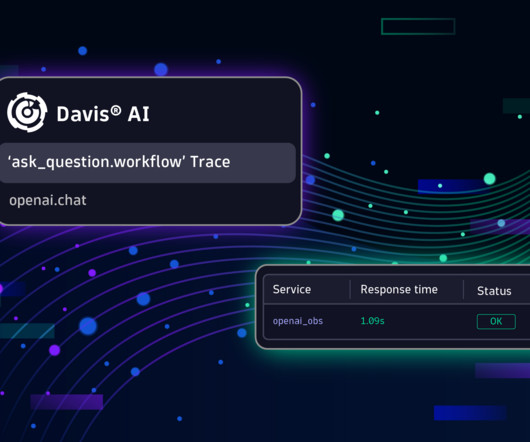
Dynatrace simplifies OpenTelemetry metric collection for context-aware AI analytics

Dynatrace

The release candidate of OpenTelemetry metrics was announced earlier this year at Kubecon in Valencia, Spain. Since then, organizations have embraced OTLP as an all-in-one protocol for observability signals, including metrics, traces, and logs, which will also gain Dynatrace support in early 2023.

Analytics 276
Insiders

Sign Up for our Newsletter

This site is protected by reCAPTCHA and the Google Privacy Policy and Terms of Service apply.

Trending Sources

article thumbnail

AI-driven analysis of Spring Micrometer metrics in context, with typology at scale

Dynatrace

One of these solutions is Micrometer which provides 17+ pre-instrumented JVM-based frameworks for data collection and enables instrumentation code with a vendor-neutral API. Micrometer is used for instrumenting both out-of-the-box and custom metrics from Spring Boot applications. That’s a large amount of data to handle. of Micrometer.

Metrics 203
article thumbnail

The road to observability with OpenTelemetry demo part 1: Identifying metrics and traces

Dynatrace

That is, relying on metrics, logs, and traces to understand what software is doing and where it’s running into snags. While classic logging is an essential tool in debugging issues, it often lacks context and only provides snapshot information of one specific location in your code/application.

Metrics 177
article thumbnail

AI-driven analysis of Spring Micrometer metrics in context, with topology at scale

Dynatrace

One of these solutions is Micrometer which provides 17+ pre-instrumented JVM-based frameworks for data collection and enables instrumentation code with a vendor-neutral API. Micrometer is used for instrumenting both out-of-the-box and custom metrics from Spring Boot applications. That’s a large amount of data to handle. of Micrometer.

Metrics 130
article thumbnail

Optimizing Java XPath CPU and memory overhead by 98%

Dynatrace

Solution : Use optimized methods to access / query for specific data, e.g.: getNodeByType resulted in 98% reduction of CPU usage, better performance, returned high availability and reduced operational costs. It can be your own code, 3 rd party code or your runtime that executes for certain tasks such as Garbage Collection.

Java 219