article thumbnail

Crucial Redis Monitoring Metrics You Must Watch

Scalegrid

Key metrics like throughput, request latency, and memory utilization are essential for assessing Redis health, with tools like the MONITOR command and Redis-benchmark for latency and throughput analysis and MEMORY USAGE/STATS commands for evaluating memory. In addition, distributed data is a key factor in high availability.

Metrics 130
article thumbnail

What is infrastructure monitoring and why is it mission-critical in the new normal?

Dynatrace

As IT infrastructure has become increasingly distributed and complex, organizations face the challenge of aligning business objectives and end-user experience with the availability and performance of the IT infrastructure. AI-assistance: Use AI to detect anomalies and benchmark your system. What is infrastructure monitoring? .

Insiders

Sign Up for our Newsletter

This site is protected by reCAPTCHA and the Google Privacy Policy and Terms of Service apply.

Trending Sources

article thumbnail

HammerDB CLI 101

HammerDB

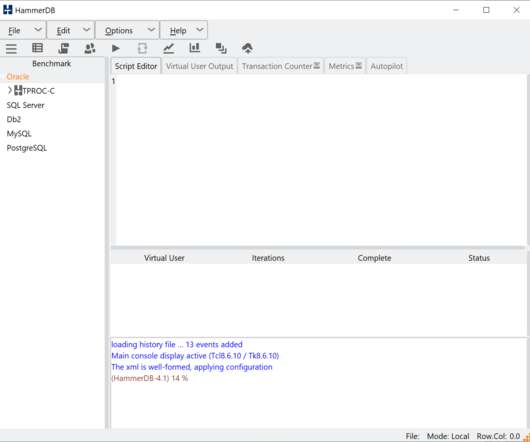
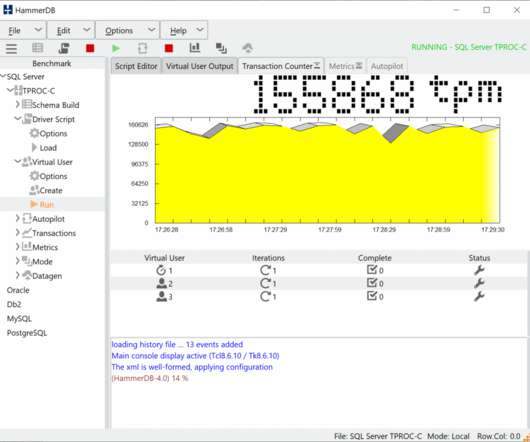
This displays the available CLI commands with “help command” providing detailed information about the command and arguments required. This will show the benchmark options dialog. Benchmark Options. and benchmark set with the bm argument. In the CLI the print dict command shows us the available options.

article thumbnail

PostgreSQL Performance Tuning: Optimizing Database Parameters for Maximum Efficiency

Percona

PostgreSQL performance optimization is an ongoing process involving monitoring, benchmarking, and adjustments to maintain high-performing PostgreSQL databases. The PostgreSQL buffer is called shared_buffer, which is the most effective tunable parameter for most operating systems. Why is PostgreSQL performance tuning important?

Tuning 52
article thumbnail

Five-nines availability: Always-on infrastructure delivers system availability during the holidays’ peak loads

Dynatrace

The nirvana state of system uptime at peak loads is known as “five-nines availability.” In its pursuit, IT teams hover over system performance dashboards hoping their preparations will deliver five nines—or even four nines—availability. But is five nines availability attainable? Downtime per year. 90% (one nine).

article thumbnail

What Adrian Did Next?—?Part 2?—?Sun Microsystems

Adrian Cockcroft

Another big jump, but now it was my job to run benchmarks in the lab, and write white papers that explained the new products to the world, as they were launched. I was mostly coding in C, tuning FORTRAN, and when I needed to do a lot of data analysis of benchmark results used the S-PLUS statistics language, that is the predecessor to R.

Tuning 52
article thumbnail

Tuning PostgreSQL Database Parameters to Optimize Performance

Percona

The PostgreSQL buffer is called shared_buffer which is the most effective tunable parameter for most operating systems. It’s low because certain machines and operating systems do not support higher values. The effective_cache_size provides an estimate of the memory available for disk caching. wal_buffers.

Tuning 55