article thumbnail

7 Top Kubernetes Health Metrics You Must Monitor

DZone

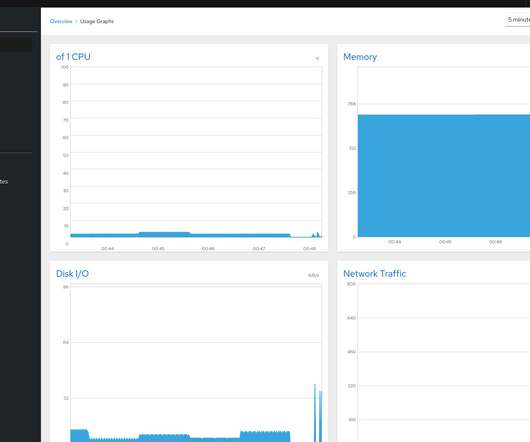
A highly efficient Kubernetes setup generates innumerable new metrics every day, making monitoring cluster health quite challenging. You might find yourself sifting through several different metrics without being entirely sure which ones are the most insightful and warrant utmost attention.

Metrics 257
article thumbnail

A Comprehensive Approach to Performance Monitoring and Observability

DZone

This is an article from DZone's 2023 Observability and Application Performance Trend Report. For more: Read the Report Agile development practices must be supported by an agile monitoring framework.

Insiders

Sign Up for our Newsletter

This site is protected by reCAPTCHA and the Google Privacy Policy and Terms of Service apply.

Trending Sources

article thumbnail

Monitor API Health Check With Prometheus

DZone

Also, APISIX integrates with Prometheus through its plugin that exposes upstream nodes (multiple instances of a backend API service that APISIX manages) health check metrics on the Prometheus metrics endpoint typically, on URL path /apisix/prometheus/metrics.

article thumbnail

Elevating System Management: The Role of Monitoring and Observability in DevOps

DZone

Monitoring and observability are two key concepts that facilitate this process, offering valuable visibility into the health and performance of systems. In this article, we will explore the differences between monitoring and observability, provide examples to illustrate their applications and highlight their respective benefits.

DevOps 316
article thumbnail

Observability engineering: Getting Prometheus metrics right for Kubernetes with Dynatrace and Kepler

Dynatrace

To get a more granular look into telemetry data, many analysts rely on custom metrics using Prometheus. Named after the Greek god who brought fire down from Mount Olympus, Prometheus metrics have been transforming observability since the project’s inception in 2012.

Metrics 183
article thumbnail

CDN Observability: Why You Must Monitor Your Extended Infrastructure

DZone

However, the extended infrastructure of CDNs requires diligent monitoring to ensure optimal performance and identify potential issues. In this article, we will explore the importance of CDN observability and how it contributes to the success of online businesses. What Is CDN Observability? What Is CDN Observability?

article thumbnail

Percona Operators Custom Resource Monitoring With Kube-state-metrics

Percona

With Percona Operators , users can easily deploy, monitor, and manage databases orchestrated by Kubernetes, making it easier and more efficient to run databases at scale. Our Operators come with Custom Resources that have their own statuses and fields to ease monitoring and troubleshooting. Once captured, the metrics are exposed.

Metrics 68