Remove Analytics Remove Database Remove Engineering Remove Java
article thumbnail

How a data lakehouse brings data insights to life

Dynatrace

For IT infrastructure managers and site reliability engineers, or SREs , logs provide a treasure trove of data. These traditional approaches to log monitoring and log analytics thwart IT teams’ goal to address infrastructure performance problems, security threats, and user experience issues. where an error occurred at the code level.

Analytics 217
article thumbnail

Unmatched scalability and security of Dynatrace extensions now available for all supported technologies: 7 reasons to migrate your JMX and Python plugins

Dynatrace

already address SNMP, WMI, SQL databases, and Prometheus technologies, serving the monitoring needs of hundreds of Dynatrace customers. focused on technology coverage, building on the flexibility of JMX for Java and Python-based coded extensions for everything else. and focusing on a much-improved version 2.0 Extensions 2.0

Insiders

Sign Up for our Newsletter

This site is protected by reCAPTCHA and the Google Privacy Policy and Terms of Service apply.

Trending Sources

article thumbnail

Tutorial: Guide to automated SRE-driven performance engineering

Dynatrace

In this blog, I will be going through a step-by-step guide on how to automate SRE-driven performance engineering. If you have a distributed environment with multiple servers hosting your webservers, app servers, and database, I suggest you install the OneAgent on all these servers to get full end-to-end visibility. Dynatrace news.

article thumbnail

Top 13 Site Reliability Engineer (SRE) Tools

Dotcom-Montior

The role and responsibilities of a site reliability engineer (SRE) may vary depending on the size of the organization. For the most part, a site reliability engineer is focused on multiple tasks and projects at one time, so for most SREs, the various tools they use reflect their eve-evolving responsibilities. Programming Languages.

article thumbnail

Adding New Capabilities for Real-Time Analytics to Azure IoT

ScaleOut Software

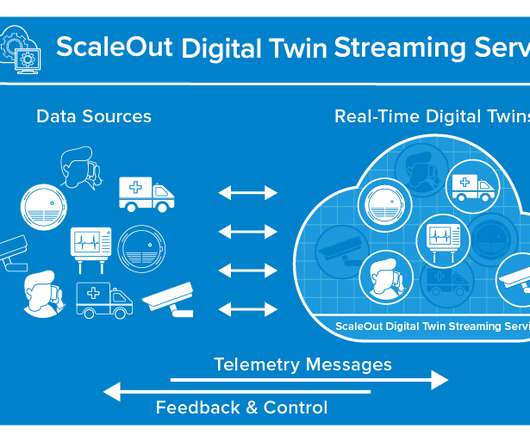
Whether it’s health-tracking watches, long-haul trucks, or security sensors, extracting value from these devices requires streaming analytics that can quickly make sense of the telemetry and intelligently react to handle an emerging issue or capture a new opportunity.

IoT 52
article thumbnail

Scalable Annotation Service?—?Marken

The Netflix TechBlog

All data should be also available for offline analytics in Hive/Iceberg. A data model in Marken can be described using schema — just like how we create schemas for database tables etc. Unlike Java, we support multiple inheritance as well. The databases we pick should be able to scale horizontally.

article thumbnail

Dynatrace memory analysis helps Product Architects identify unknown unknowns

Dynatrace

For instance, everything related to our correlations engine is dark orange, and the different protocols are mustard colored. While the amount of bytes allocated for the Java API is typically 1.5X the average, in this case, the allocation for the Java API was more than 3X higher than the average, 41 TiB.

Java 205