Remove Analysis Remove Latency Remove Network Remove Processing
article thumbnail

For your eyes only: improving Netflix video quality with neural networks

The Netflix TechBlog

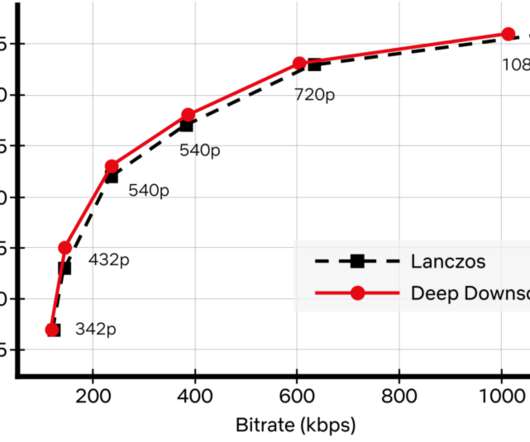
Recently, we added another powerful tool to our arsenal: neural networks for video downscaling. In this tech blog, we describe how we improved Netflix video quality with neural networks, the challenges we faced and what lies ahead. How can neural networks fit into Netflix video encoding?

Network 292
article thumbnail

How To Measure the Network Impact on PostgreSQL Performance

Percona

We often forget or take for granted the network hops involved and the additional overhead it creates on the overall performance. TCP/IP connection, triggered me to write about other aspects of network impact on performance. How to detect and measure the impact There is no easy mechanism for measuring the impact of network overhead.

Network 65
Insiders

Sign Up for our Newsletter

This site is protected by reCAPTCHA and the Google Privacy Policy and Terms of Service apply.

Trending Sources

article thumbnail

Optimize your environment: Unveiling Dynatrace Hyper-V extension for enhanced performance and efficient troubleshooting

Dynatrace

Firstly, managing virtual networks can be complex as networking in a virtual environment differs significantly from traditional networking. This leads to a more efficient and streamlined experience for users. Challenges with running Hyper-V Working with Hyper-V can come with several challenges.

article thumbnail

Site reliability done right: 5 SRE best practices that deliver on business objectives

Dynatrace

Uptime Institute’s 2022 Outage Analysis report found that over 60% of system outages resulted in at least $100,000 in total losses, up from 39% in 2019. The growing amount of data processed at the network edge, where failures are more difficult to prevent, magnifies complexity. availability.

article thumbnail

Redis® Monitoring Strategies for 2024

Scalegrid

Identifying key Redis® metrics such as latency, CPU usage, and memory metrics is crucial for effective Redis monitoring. To monitor Redis® instances effectively, collect Redis metrics focusing on cache hit ratio, memory allocated, and latency threshold.

Strategy 130
article thumbnail

Dynatrace supports SnapStart for Lambda as an AWS launch partner

Dynatrace

The new Amazon capability enables customers to improve the startup latency of their functions from several seconds to as low as sub-second (up to 10 times faster) at P99 (the 99th latency percentile). This can cause latency outliers and may lead to a poor end-user experience for latency-sensitive applications.

Lambda 225
article thumbnail

Crucial Redis Monitoring Metrics You Must Watch

Scalegrid

These can help you ensure your system’s health and quickly perform root cause analysis of any performance-related issue you might be encountering. Understanding Redis Performance Indicators Redis is designed to handle high traffic and low latency with its in-memory data store and efficient data structures.

Metrics 130