Remove Analysis Remove Efficiency Remove Metrics Remove Processing
article thumbnail

Business Flow: Why IT operations teams should monitor business processes

Dynatrace

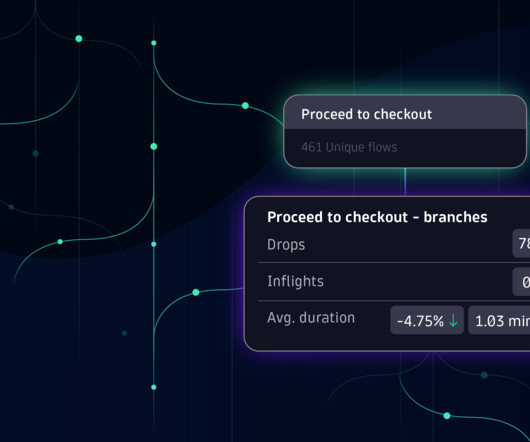
The business process observability challenge Increasingly dynamic business conditions demand business agility; reacting to a supply chain disruption and optimizing order fulfillment are simple but illustrative examples. Most business processes are not monitored. First and foremost, it’s a data problem.

article thumbnail

Dynatrace log collection for ARM unlocks power-efficient architecture for your enterprise

Dynatrace

This growth was spurred by mobile ecosystems with Android and iOS operating systems, where ARM has a unique advantage in energy efficiency while offering high performance. Energy efficiency and carbon footprint outshine x86 architectures The first clear benefit of ARM in the enterprise IT landscape is energy efficiency.

Insiders

Sign Up for our Newsletter

This site is protected by reCAPTCHA and the Google Privacy Policy and Terms of Service apply.

Trending Sources

article thumbnail

Practical business process monitoring for real-time business observability

Dynatrace

One of the more popular use cases is monitoring business processes, the structured steps that produce a product or service designed to fulfill organizational objectives. By treating processes as assets with measurable key performance indicators (KPIs), business process monitoring helps IT and business teams align toward shared business goals.

article thumbnail

Perform 2023 Guide: Organizations mine efficiencies with automation, causal AI

Dynatrace

Data proliferation—as well as a growing need for data analysis—has accelerated. They now use modern observability to monitor expanding cloud environments in order to operate more efficiently, innovate faster and more securely, and to deliver consistently better business results. What is a data lakehouse?

article thumbnail

Conducting log analysis with an observability platform and full data context

Dynatrace

Modern organizations ingest petabytes of data daily, but legacy approaches to log analysis and management cannot accommodate this volume of data. Traditional log analysis evaluates logs and enables organizations to mitigate myriad risks and meet compliance regulations. But they struggle to store unstructured data.

Analytics 190
article thumbnail

Crucial Redis Monitoring Metrics You Must Watch

Scalegrid

You will need to know which monitoring metrics for Redis to watch and a tool to monitor these critical server metrics to ensure its health. Redis returns a big list of database metrics when you run the info command on the Redis shell. You can pick a smart selection of relevant metrics from these.

Metrics 130
article thumbnail

Observability engineering: Getting Prometheus metrics right for Kubernetes with Dynatrace and Kepler

Dynatrace

To get a more granular look into telemetry data, many analysts rely on custom metrics using Prometheus. Named after the Greek god who brought fire down from Mount Olympus, Prometheus metrics have been transforming observability since the project’s inception in 2012.

Metrics 180