article thumbnail

Automate complex metric-related use cases with the Metrics API version 2

Dynatrace

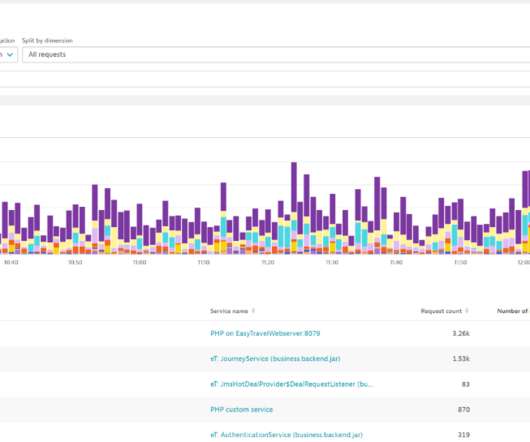
Dynatrace collects a huge number of metrics for each OneAgent-monitored host in your environment. Depending on the types of technologies you’re running on individual hosts, the average number of metrics is about 500 per computational node. Running metric queries on a subset of entities for live monitoring and system overviews.

Metrics 226
article thumbnail

Crucial Redis Monitoring Metrics You Must Watch

Scalegrid

You will need to know which monitoring metrics for Redis to watch and a tool to monitor these critical server metrics to ensure its health. Redis returns a big list of database metrics when you run the info command on the Redis shell. You can pick a smart selection of relevant metrics from these.

Metrics 130
Insiders

Sign Up for our Newsletter

This site is protected by reCAPTCHA and the Google Privacy Policy and Terms of Service apply.

Trending Sources

article thumbnail

Announcing enterprise-grade observability at scale for your OpenTelemetry custom metrics

Dynatrace

As the application owner of an e-commerce application, for example, you can enrich the source code of your application with domain-specific knowledge by adding actionable semantics to collected performance or business metrics. New OpenTelemetry metrics exporters provide the broadest language support on the market.

Metrics 151
article thumbnail

Multidimensional analysis 2.0: Analyze, chart, and report on microservices-based metrics without code changes

Dynatrace

In an existing application landscape, however, it can be difficult to get to those metrics. A larger financial institution is using the analysis to report business metrics on dashboards and make them accessible via the Dynatrace API. Optimize your application and business performance by analyzing request- and service-based metrics.

Metrics 159
article thumbnail

Multidimensional analysis 2.0: Analyze microservice-based metrics without code changes (Part 2)

Dynatrace

In Part 1 of this blog series , we presented a few Dynatrace customer use cases for multidimensional analysis. For example, we presented how a multinational travel agency uses MDA to diagnose error rates per loyalty status to make sure that their premium customers have a perfect software experience. Dynatrace news.

Metrics 166
article thumbnail

Machine Learning for Fraud Detection in Streaming Services

The Netflix TechBlog

We present a systematic overview of the unexpected streaming behaviors together with a set of model-based and data-driven anomaly detection strategies to identify them. Data Featurization A complete list of features used in this work is presented in Table 1. The features mainly belong to two distinct classes.

C++ 312
article thumbnail

Efficient SLO event integration powers successful AIOps

Dynatrace

For instance, consider how fine-tuned failure rate detection can provide insights for comprehensive understanding. Please refer to How to fine-tune failure detection (dynatrace.com) for further information. Data Explorer “test your Metric Expression” for info result coming from the above metric.