article thumbnail

The new normal of digital experience delivery – lessons learned from monitoring mission-critical websites during COVID-19

Dynatrace

Over the last two month s, w e’ve monito red key sites and applications across industries that have been receiving surges in traffic , including government, health insurance, retail, banking, and media. s tate home websites/portals , COVID -19 and employment portals on an ongoing basis since the last week of March. .

Website 214
article thumbnail

COVID-19 and Digital Services: An Action Plan for the Unexpected

Dynatrace

While most government agencies and commercial enterprises have digital services in place, the current volume of usage — including traffic to critical employment, health and retail/eCommerce services — has reached levels that many organizations have never seen before or tested against. Let’s look at news/media sites, for example (figure 6).

Traffic 206
Insiders

Sign Up for our Newsletter

This site is protected by reCAPTCHA and the Google Privacy Policy and Terms of Service apply.

Trending Sources

article thumbnail

London Calling! An AWS Region is coming to the UK!

All Things Distributed

Mid-sized Organisations – Haven Power , Holiday Extras , ">Exeter Family Friendly , ">Royal Opera House , ">Total Jobs , Retail Companies – Shop Direct , Nisa Retail , Kurt Geiger , Sport Pursuit. Media and Entertainment – BBC , Channel 4 , ITV , News UK , The FT , Trinity Mirror , The Guardian.

AWS 167
article thumbnail

Industry page speed benchmarks (March 2022)

Speed Curve

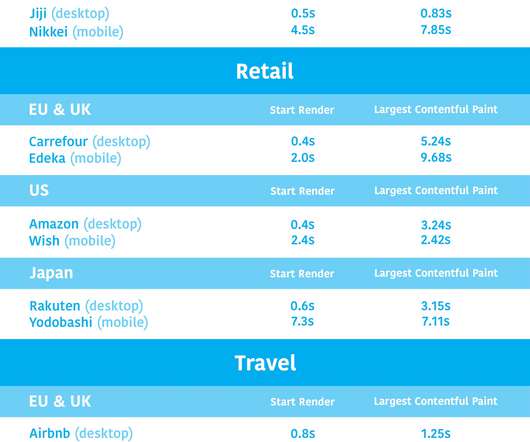
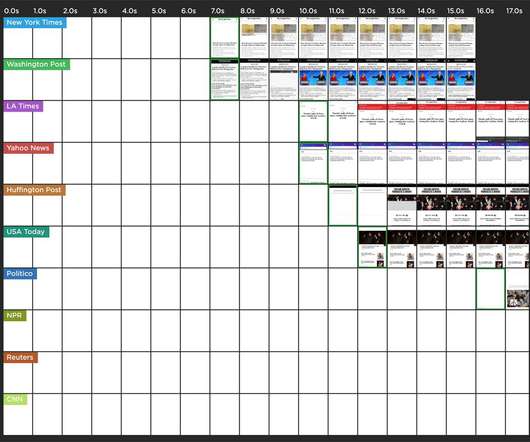
Page Speed Benchmarks is an interactive dashboard that lets you explore and compare web performance data for leading websites across several industries – from retail to media – over the past year. Fastest Media Sites. Fastest Retail Sites. UK & EU. The Guardian ( view desktop test results ).

article thumbnail

Introducing Page Speed Benchmarks – a new resource for the performance community

Speed Curve

Page Speed Benchmarks is an interactive dashboard that lets you explore and compare web performance data for leading websites across several industries – from retail to media. Home pages of 10 leading sites in the US and the EU, in each of the following industries: Auto, Finance, Media, Retail, Tech, and Travel. (We’ll

article thumbnail

Why you need to know your site's performance poverty line (and how to find it)

Speed Curve

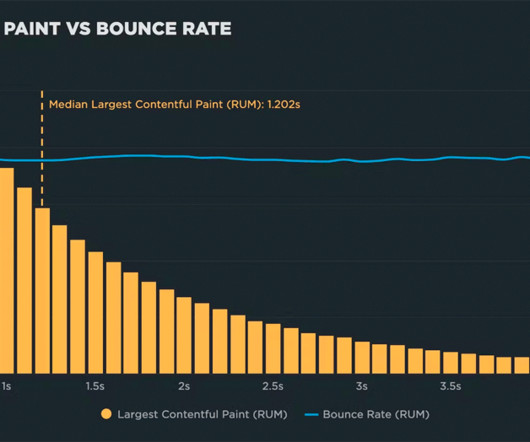
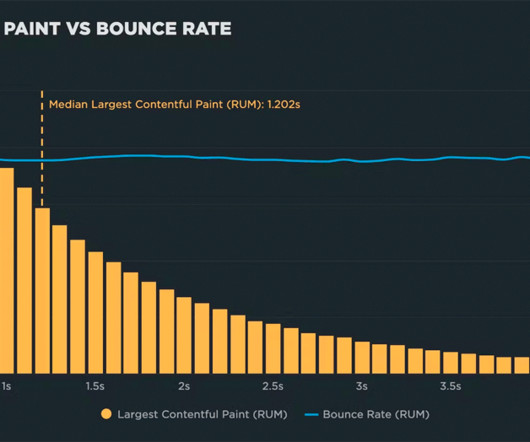
The performance poverty line is the plateau at which changes to your website’s rendering metrics (such as Start Render and Largest Contentful Paint) cease to matter because you’ve bottomed out in terms of business and user engagement metrics. If you work on a media site, then page views and bounce rate matter.

article thumbnail

A Complete Guide to Performance Budgets

Speed Curve

It's easier to make a fast website than it is to keep a website fast. Media sites are particularly prone to this issue. If you've invested countless hours in speeding up your pages, but you're not using performance budgets to prevent regressions, you could be at risk of wasting all your efforts.