article thumbnail

Extend infrastructure observability with JMX Extensions and additional full-stack metrics

Dynatrace

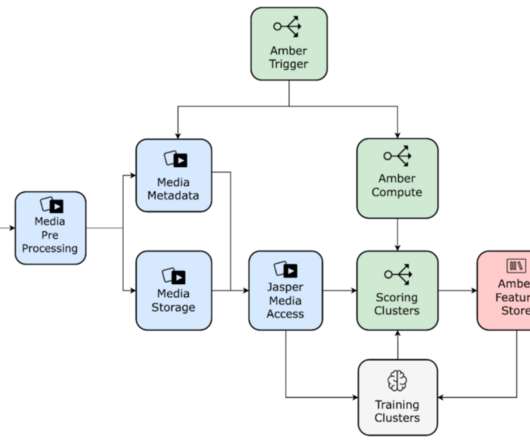
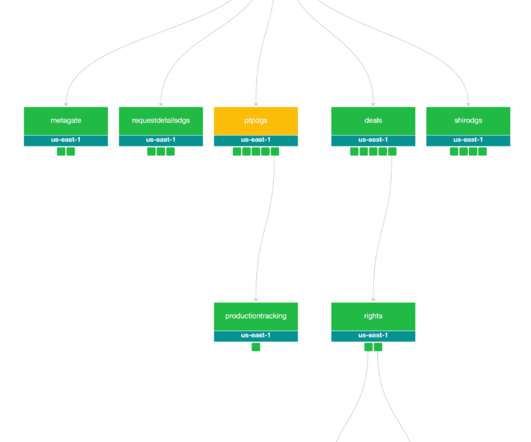
Infrastructure exists to support the backing services that are collectively perceived by users to be your web application. Issues that manifest themselves as performance degradation on a user’s device can often be traced back to underlying infrastructure issues. Monitor additional metrics. Dynatrace news.

article thumbnail

Managing hybrid cloud infrastructure with an observability platform

Dynatrace

While many companies now enlist public cloud services such as Amazon Web Services, Google Public Cloud, or Microsoft Azure to achieve their business goals, a majority also use hybrid cloud infrastructure to accommodate traditional applications that can’t be easily migrated to public clouds. How to modernize for hybrid cloud.

Insiders

Sign Up for our Newsletter

This site is protected by reCAPTCHA and the Google Privacy Policy and Terms of Service apply.

Trending Sources

article thumbnail

Dynatrace simplifies OpenTelemetry metric collection for context-aware AI analytics

Dynatrace

The release candidate of OpenTelemetry metrics was announced earlier this year at Kubecon in Valencia, Spain. Since then, organizations have embraced OTLP as an all-in-one protocol for observability signals, including metrics, traces, and logs, which will also gain Dynatrace support in early 2023. What’s ahead in 2023.

Analytics 272
article thumbnail

Building Netflix’s Distributed Tracing Infrastructure

The Netflix TechBlog

Now let’s look at how we designed the tracing infrastructure that powers Edgar. This insight led us to build Edgar: a distributed tracing infrastructure and user experience. Our tactical approach was to use Netflix-specific libraries for collecting traces from Java-based streaming services until open source tracer libraries matured.

article thumbnail

Automatic and intelligent end-to-end observability for OpenTelemetry Java

Dynatrace

Today, Dynatrace is happy to announce OneAgent support for discovering and automatically capturing OpenTelemetry trace data for Java. PurePath integrates OpenTelemetry Java data for enterprise-grade collection and contextual analytics. OpenTelemetry Java API version 1.0.0 Use-case example: WorldAtlas sample application.

Java 152
article thumbnail

Dynatrace extends AI-powered observability for SAP together with PowerConnect

Dynatrace

Monitoring SAP products can present challenges Monitoring SAP systems can be challenging due to the inherent complexity of using different technologies—such as ABAP, Java, and cloud offerings—and the sheer amount of generated data. SAP HANA server infrastructure monitored with OneAgent.

Java 182
article thumbnail

The road to observability with OpenTelemetry demo part 1: Identifying metrics and traces

Dynatrace

That is, relying on metrics, logs, and traces to understand what software is doing and where it’s running into snags. In addition to tracing, observability also defines two other key concepts, metrics and logs. When software runs in a monolithic stack on on-site servers, observability is manageable enough.

Metrics 174