Remove Hardware Remove Network Remove Speed Remove Traffic
article thumbnail

Five-nines availability: Always-on infrastructure delivers system availability during the holidays’ peak loads

Dynatrace

For retail organizations, peak traffic can be a mixed blessing. While high-volume traffic often boosts sales, it can also compromise uptimes. Instead, to speed up response times, applications are now processing most data at the network’s perimeter, closest to the data’s origin.

article thumbnail

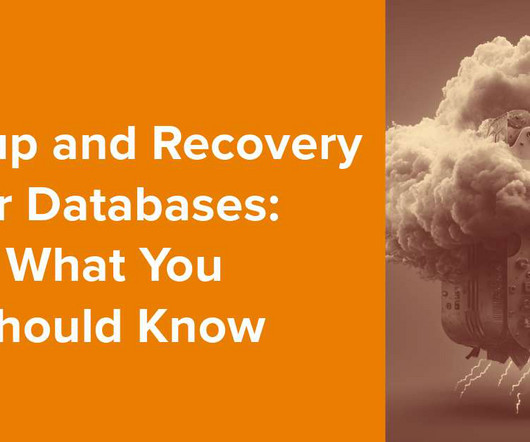
Backup and Recovery for Databases: What You Should Know

Percona

In general terms, here are potential trouble spots: Hardware failure: Manufacturing defects, wear and tear, physical damage, and other factors can cause hardware to fail. heat) can damage hardware components and prompt data loss. Human mistakes: Incorrect configuration is an all-too-common cause of hardware and software failure.

Insiders

Sign Up for our Newsletter

This site is protected by reCAPTCHA and the Google Privacy Policy and Terms of Service apply.

Trending Sources

article thumbnail

How to Optimize Digital Experience and Operations with Dynatrace

Dynatrace

Reducing CPU Utilization to now only consume 15% of initially provisioned hardware. Too many fine-grained services leading to network and communication overhead. Dynatrace gave them automated insights into traffic behavior and the impact of queued up requests to the end-users (up to 3s queue time). Infrastructure Optimization.

Cache 201
article thumbnail

MySQL Key Performance Indicators (KPI) With PMM

Percona

Query performance Query performance is a key performance indicator (KPI) in MySQL, as it measures the efficiency and speed of query execution. That said, it should also be monitored for usage, which will exhibit the traffic pressuring them. This is not an exhaustive list but an example of what we can watch for.

article thumbnail

Why Traditional Monitoring Isn’t Enough for Modern Web Applications

Dotcom-Montior

Network or connection error. Modern web applications and pages, such as single-page applications, that put the user experience at its utmost priority are expected to be available 24/7, anywhere in the world, usable on any screen size, secure, flexible, scalable and be ready to meet traffic spikes on demand. Network latency.

article thumbnail

Crucial Redis Monitoring Metrics You Must Watch

Scalegrid

Understanding Redis Performance Indicators Redis is designed to handle high traffic and low latency with its in-memory data store and efficient data structures. Effective monitoring of key performance indicators plays a crucial role in maintaining this optimal speed of operation. It further causes the slave to serve stale data.

Metrics 130
article thumbnail

Key Advantages of DBMS for Efficient Data Management

Scalegrid

Types of DBMS DBMS can be classified into hierarchical, network, relational, and object-oriented types. However, some challenges may arise when scaling a DBMS, such as improper traffic distribution, inefficient database management, and performance issues.