article thumbnail

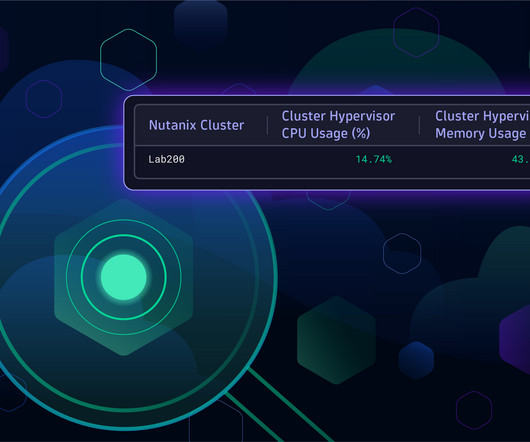
Get seamless insights into Nutanix clusters with Dynatrace

Dynatrace

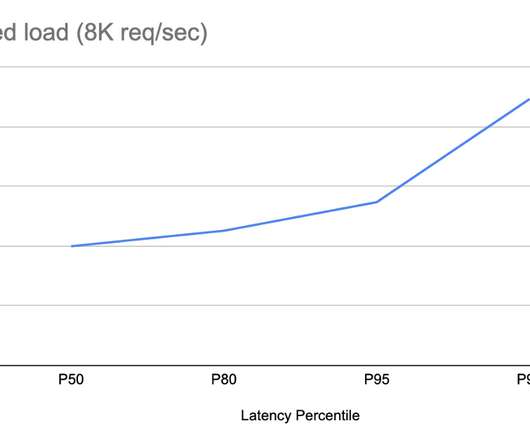
Performance monitoring Dynatrace can collect performance metrics from Nutanix clusters, including latency, IOPS (Input/Output Operations Per Second), and network throughput. Storage container metrics Track the usage and performance of storage containers to optimize resource allocation.

article thumbnail

Optimize your environment: Unveiling Dynatrace Hyper-V extension for enhanced performance and efficient troubleshooting

Dynatrace

Secondly, determining the correct allocation of resources (CPU, memory, storage) to each virtual machine to ensure optimal performance without over-provisioning can be difficult. Firstly, managing virtual networks can be complex as networking in a virtual environment differs significantly from traditional networking.

Insiders

Sign Up for our Newsletter

This site is protected by reCAPTCHA and the Google Privacy Policy and Terms of Service apply.

Trending Sources

article thumbnail

Designing Instagram

High Scalability

Firstly, the synchronous process which is responsible for uploading image content on file storage, persisting the media metadata in graph data-storage, returning the confirmation message to the user and triggering the process to update the user activity. Fetching User Feed. Sample Queries supported by Graph Database. Optimization.

Design 334
article thumbnail

Improved Alerting with Atlas Streaming Eval

The Netflix TechBlog

While Atlas is architected around compute & storage separation, and we could theoretically just scale the query layer to meet the increased query demand, every query, regardless of its type, has a data component that needs to be pushed down to the storage layer. This is one of the reasons it has taken us years to get here.

Storage 288
article thumbnail

Uber’s Big Data Platform: 100+ Petabytes with Minute Latency

Uber Engineering

To accomplish this, Uber relies heavily on making data-driven decisions at every level, from forecasting rider demand during high traffic events to identifying and addressing bottlenecks … The post Uber’s Big Data Platform: 100+ Petabytes with Minute Latency appeared first on Uber Engineering Blog.

Big Data 109
article thumbnail

Migrating Critical Traffic At Scale with No Downtime?—?Part 1

The Netflix TechBlog

It provides a good read on the availability and latency ranges under different production conditions. The upstream service calls the existing and new replacement services concurrently to minimize any latency increase on the production path. Logging is selective to cases where the old and new responses do not match.

Traffic 339
article thumbnail

Implementing AWS well-architected pillars with automated workflows

Dynatrace

Dynatrace AutomationEngine workflows automate release validation using AWS Well-Architected pillars With Dynatrace, you can create workflows that automate various tasks based on events, schedules or Davis problem triggers. Workflows are powered by a core platform technology of Dynatrace called the AutomationEngine.

AWS 247