article thumbnail

Protecting critical infrastructure and services: Ensure efficient, accurate information delivery this election year

Dynatrace

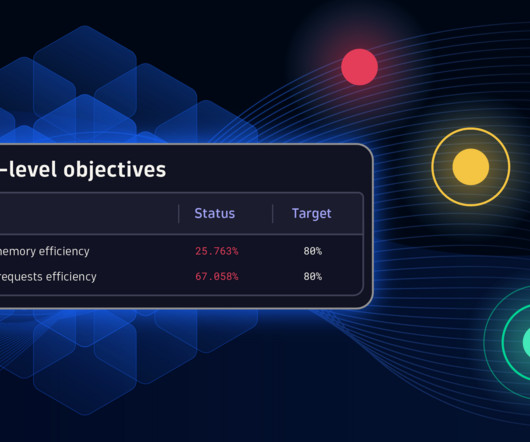
Government agencies aim to meet their citizens’ needs as efficiently and effectively as possible to ensure maximum impact from every tax dollar invested. In contrast, observability enables teams to understand a system’s internal state by analyzing the data it generates, including logs, metrics, and traces.

article thumbnail

SVT-AV1: an open-source AV1 encoder and decoder

The Netflix TechBlog

SVT-AV1: open-source AV1 encoder and decoder by Andrey Norkin , Joel Sole , Mariana Afonso , Kyle Swanson, Agata Opalach , Anush Moorthy , Anne Aaron SVT-AV1 is an open-source AV1 codec implementation hosted on GitHub [link] under a BSD + patent license.

Insiders

Sign Up for our Newsletter

This site is protected by reCAPTCHA and the Google Privacy Policy and Terms of Service apply.

Trending Sources

article thumbnail

Dynatrace simplifies OpenTelemetry metric collection for context-aware AI analytics

Dynatrace

The release candidate of OpenTelemetry metrics was announced earlier this year at Kubecon in Valencia, Spain. Since then, organizations have embraced OTLP as an all-in-one protocol for observability signals, including metrics, traces, and logs, which will also gain Dynatrace support in early 2023. What’s ahead in 2023.

Analytics 286
article thumbnail

Perform 2023 Guide: Organizations mine efficiencies with automation, causal AI

Dynatrace

They now use modern observability to monitor expanding cloud environments in order to operate more efficiently, innovate faster and more securely, and to deliver consistently better business results. Further, automation has become a core strategy as organizations migrate to and operate in the cloud.

article thumbnail

What is observability? Not just logs, metrics and traces

Dynatrace

In IT and cloud computing, observability is the ability to measure a system’s current state based on the data it generates, such as logs, metrics, and traces. Organizations usually implement observability using a combination of instrumentation methods including open-source instrumentation tools, such as OpenTelemetry.

Metrics 363
article thumbnail

Observability engineering: Getting Prometheus metrics right for Kubernetes with Dynatrace and Kepler

Dynatrace

To get a more granular look into telemetry data, many analysts rely on custom metrics using Prometheus. Named after the Greek god who brought fire down from Mount Olympus, Prometheus metrics have been transforming observability since the project’s inception in 2012. What is Prometheus?

Metrics 183
article thumbnail

Mastering Prometheus: Unlocking Actionable Insights and Enhanced Monitoring in Kubernetes Environments

DZone

However, managing its health and performance efficiently necessitates a robust monitoring solution. Prometheus, a powerful open-source monitoring system, emerges as a perfect fit for this role, especially when integrated with Kubernetes. Kubernetes, the de-facto orchestration platform, offers scalability and agility.