article thumbnail

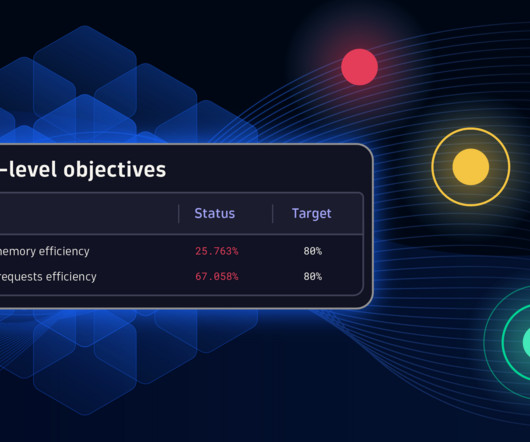
Efficient SLO event integration powers successful AIOps

Dynatrace

Next, a pragmatic approach involves examining the backend, focusing on Service type entities prominently exposed to the frontend (for example, Apache Tomcat in a Linux environment). In today’s landscape, we lack a clear understanding of properly creating frontend SLOs (for example, RUM application type entities) based on key user actions.

article thumbnail

Install Prometheus on Kubernetes: Tutorial and Examples

DZone

As one of the most popular open-source Kubernetes monitoring solutions, Prometheus leverages a multidimensional data model of time-stamped metric data and labels. The platform uses a pull-based architecture to collect metrics from various targets. These considerations include:

Insiders

Sign Up for our Newsletter

This site is protected by reCAPTCHA and the Google Privacy Policy and Terms of Service apply.

Trending Sources

article thumbnail

Dynatrace log collection for ARM unlocks power-efficient architecture for your enterprise

Dynatrace

This growth was spurred by mobile ecosystems with Android and iOS operating systems, where ARM has a unique advantage in energy efficiency while offering high performance. Energy efficiency and carbon footprint outshine x86 architectures The first clear benefit of ARM in the enterprise IT landscape is energy efficiency.

article thumbnail

Protecting critical infrastructure and services: Ensure efficient, accurate information delivery this election year

Dynatrace

Government agencies aim to meet their citizens’ needs as efficiently and effectively as possible to ensure maximum impact from every tax dollar invested. For example, government agencies use an array of cloud platforms spanning 12 environments on average. The critical Log4Shell vulnerability is a recent example.

article thumbnail

Service level objective examples: 5 SLO examples for faster, more reliable apps

Dynatrace

Certain service-level objective examples can help organizations get started on measuring and delivering metrics that matter. Teams can build on these SLO examples to improve application performance and reliability. In this post, I’ll lay out five SLO examples that every DevOps and SRE team should consider.

Traffic 173
article thumbnail

Crucial Redis Monitoring Metrics You Must Watch

Scalegrid

You will need to know which monitoring metrics for Redis to watch and a tool to monitor these critical server metrics to ensure its health. Redis returns a big list of database metrics when you run the info command on the Redis shell. You can pick a smart selection of relevant metrics from these.

Metrics 130
article thumbnail

Dynatrace simplifies OpenTelemetry metric collection for context-aware AI analytics

Dynatrace

The release candidate of OpenTelemetry metrics was announced earlier this year at Kubecon in Valencia, Spain. Since then, organizations have embraced OTLP as an all-in-one protocol for observability signals, including metrics, traces, and logs, which will also gain Dynatrace support in early 2023.

Analytics 286