article thumbnail

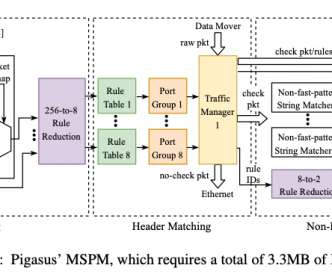
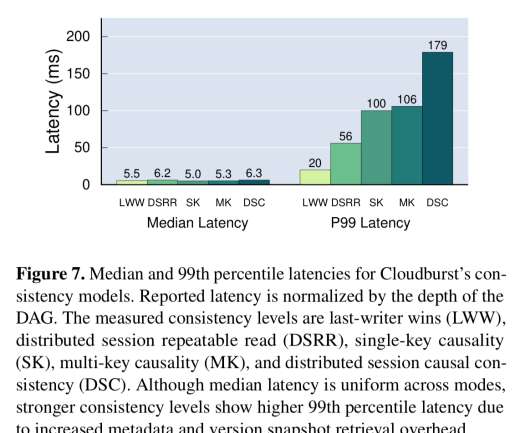
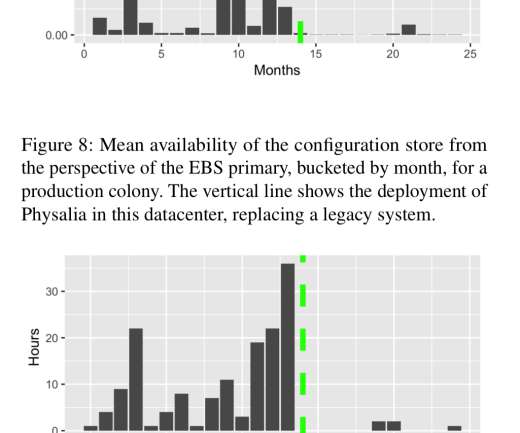
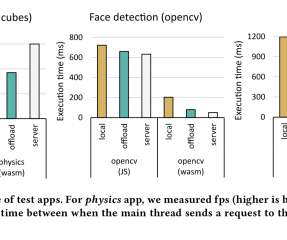
Interpreting A/B test results: false negatives and power

The Netflix TechBlog

Martin Tingley with Wenjing Zheng , Simon Ejdemyr , Stephanie Lane , and Colin McFarland This is the fourth post in a multi-part series on how Netflix uses A/B tests to inform decisions and continuously innovate on our products. Have a look at Part 1 (Decision Making at Netflix), Part 2 (What is an A/B Test?), Need to catch up?

Testing 202
article thumbnail

The Three Cs: Concatenate, Compress, Cache

CSS Wizardry

In one test, I concatenated it all into one big file, and the other had the library split into 12 files. Read the complete test methodology. Plotted on the same horizontal axis of 1.6s, the waterfalls speak for themselves: 201ms of cumulative latency; 109ms of cumulative download. This will be referred to as css_time.

Cache 291
Insiders

Sign Up for our Newsletter

This site is protected by reCAPTCHA and the Google Privacy Policy and Terms of Service apply.

Trending Sources

article thumbnail

Benchmark (YCSB) numbers for Redis, MongoDB, Couchbase2, Yugabyte and BangDB

High Scalability

This article is to simply report the YCSB bench test results in detail for five NoSQL databases namely Redis, MongoDB, Couchbase, Yugabyte and BangDB and compare the result side by side. I have also used the default six test scenarios as defined by the YCSB framework. I have restricted it to 10M records for each test.

article thumbnail

Crucial Redis Monitoring Metrics You Must Watch

Scalegrid

Key Takeaways Critical performance indicators such as latency, CPU usage, memory utilization, hit rate, and number of connected clients/slaves/evictions must be monitored to maintain Redis’s high throughput and low latency capabilities. It can achieve impressive performance, handling up to 50 million operations per second.

Metrics 130
article thumbnail

MySQL on Azure Performance Benchmark – ScaleGrid vs. Azure Database

Scalegrid

ScaleGrid MySQL on Azure so you can see which provider offers the best throughput and latency performance. We measure latency in ms 95th percentile latency. During Read-Intensive Workloads, ScaleGrid manages to achieve up to 3 times higher throughput and averages 66% better latency compared to Azure Database.

Azure 299
article thumbnail

How Dynatrace boosts production resilience with Site Reliability Guardian

Dynatrace

The Dynatrace Site Reliability Guardian is designed for this practice; it allows development teams to define quality objectives in their code, which is validated throughout the delivery process before the code reaches production. Ultimately, the result is shared via a Slack notification to report on the current business behavior.

DevOps 186
article thumbnail

For your eyes only: improving Netflix video quality with neural networks

The Netflix TechBlog

Our approach to NN-based video downscaling The deep downscaler is a neural network architecture designed to improve the end-to-end video quality by learning a higher-quality video downscaler. We employed an adaptive network design that is applicable to the wide variety of resolutions we use for encoding.

Network 292