article thumbnail

Unlock log analytics: Seamless insights without writing queries

Dynatrace

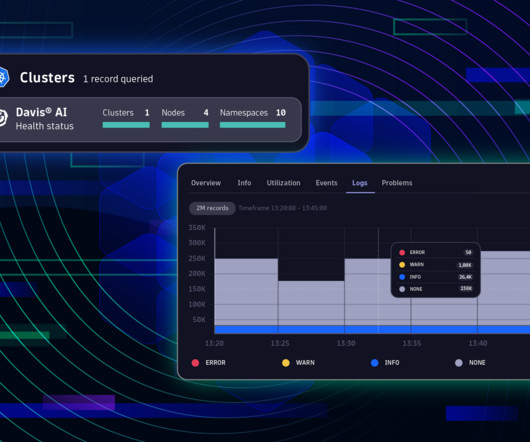
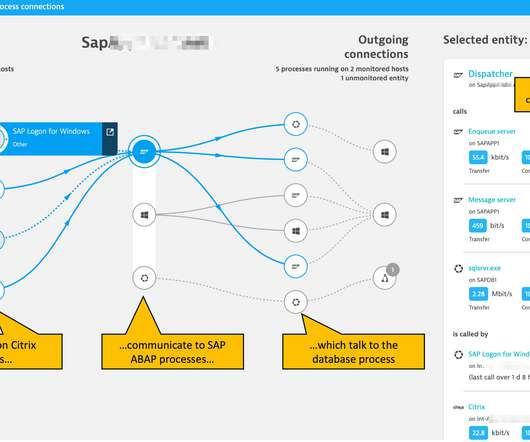
What about correlated trace data, host metrics, real-time vulnerability scanning results, or log messages captured just before an incident occurs? Depending on which app is in use, one glance at a histogram provides invaluable insight into managing clouds, databases, Kubernetes environments, and infrastructure.

Analytics 178
article thumbnail

What is cloud monitoring? How to improve your full-stack visibility

Dynatrace

These next-generation cloud monitoring tools present reports — including metrics, performance, and incident detection — visually via dashboards. Database monitoring. This ensures the database queries are performant, while also identifying host problems. Virtual machine (VM) monitoring. Website monitoring.

Cloud 230
Insiders

Sign Up for our Newsletter

This site is protected by reCAPTCHA and the Google Privacy Policy and Terms of Service apply.

Trending Sources

article thumbnail

The Ultimate Guide to Database High Availability

Percona

To make data count and to ensure cloud computing is unabated, companies and organizations must have highly available databases. A basic high availability database system provides failover (preferably automatic) from a primary database node to redundant nodes within a cluster. HA is sometimes confused with “fault tolerance.”

article thumbnail

Unmatched scalability and security of Dynatrace extensions now available for all supported technologies: 7 reasons to migrate your JMX and Python plugins

Dynatrace

already address SNMP, WMI, SQL databases, and Prometheus technologies, serving the monitoring needs of hundreds of Dynatrace customers. Extensions can monitor virtually any type of technology in your environment. Comprehensive metrics support Extensions 2.0 and focusing on a much-improved version 2.0 Extensions 2.0

article thumbnail

Kubernetes in the wild report 2023

Dynatrace

The strongest Kubernetes growth areas are security, databases, and CI/CD technologies. Accordingly, the remaining 27% of clusters are self-managed by the customer on cloud virtual machines. Strongest Kubernetes growth areas are security, databases, and CI/CD technologies. Java, Go, and Node.js

article thumbnail

Why you should benchmark your database using stored procedures

HammerDB

HammerDB uses stored procedures to achieve maximum throughput when benchmarking your database. However, there can be a lack of understanding of the benefits that stored procedures bring or if you have a benchmarking tool or database that doesn’t support stored procedures, then you have nothing to compare against.

article thumbnail

HammerDB v4.3 New Features Pt1: Graphical Metrics for PostgreSQL

HammerDB

Introducing the PostgreSQL performance metrics viewer. HammerDB included a graphical performance metrics view for the Oracle database only. HammerDB includes the same functionality for PostgreSQL enabling the user to drill down on database metrics in real time. PostgreSQL Graphical Metrics. postgresql-14.1/contrib/pg_stat_statements$

Metrics 62