

What is a message queue? How an observability platform eases message queue monitoring
Dynatrace
AUGUST 5, 2022
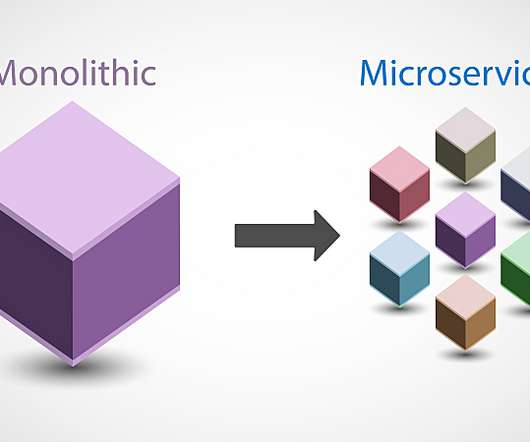
In a distributed processing environment, message queuing is similar, although the speed and volume of messages are much greater. Microservices are an increasingly popular way to build software because of their speed and flexibility compared with traditional monolithic approaches. Queued messages are typically small and specific.


Let's personalize your content